Food Lion 2012 Annual Report Download - page 157
Download and view the complete annual report
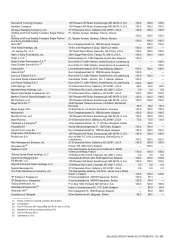
Please find page 157 of the 2012 Food Lion annual report below. You can navigate through the pages in the report by either clicking on the pages listed below, or by using the keyword search tool below to find specific information within the annual report.-
 1
1 -
2
-
3
-
4
-
5
-
6
-
7
-
8
-
9
-
10
-
11
-
12
-
13
-
14
-
15
-
16
-
17
-
18
-
19
-
20
-
21
-
22
-
23
-
24
-
25
-
26
-
27
-
28
-
29
-
30
-
31
-
32
-
33
-
34
-
35
-
36
-
37
-
38
-
39
-
40
-
41
-
42
-
43
-
44
-
45
-
46
-
47
-
48
-
49
-
50
-
51
-
52
-
53
-
54
-
55
-
56
-
57
-
58
-
59
-
60
-
61
-
62
-
63
-
64
-
65
-
66
-
67
-
68
-
69
-
70
-
71
-
72
-
73
-
74
-
75
-
76
-
77
-
78
-
79
-
80
-
81
-
82
-
83
-
84
-
85
-
86
-
87
-
88
-
89
-
90
-
91
-
92
-
93
-
94
-
95
-
96
-
97
-
98
-
99
-
100
-
101
-
102
-
103
-
104
-
105
-
106
-
107
-
108
-
109
-
110
-
111
-
112
-
113
-
114
-
115
-
116
-
117
-
118
-
119
-
120
-
121
-
122
-
123
-
124
-
125
-
126
-
127
-
128
-
129
-
130
-
131
-
132
-
133
-
134
-
135
-
136
-
137
-
138
-
139
-
140
-
141
-
142
-
143
-
144
-
145
-
146
-
 147
147 -
 148
148 -
 149
149 -
 150
150 -
 151
151 -
 152
152 -
 153
153 -
 154
154 -
 155
155 -
 156
156 -
 157
157 -
 158
158 -
 159
159 -
 160
160 -
 161
161 -
 162
162 -
 163
163 -
 164
164 -
 165
165 -
 166
166 -
 167
167 -
168
-
169
-
170
-
171
-
172
-
173
-
174
-
175
-
176
 |
 |

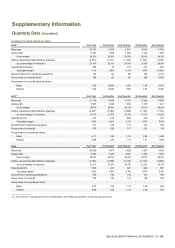
DELHAIZE GROUP FINANCIAL STATEMENTS ’12 // 155
Supplementary Information
Quarterly Data (Unaudited)
(in millions of €, except earnings per share)
2012(1)
Full Year
1st Quarter
2nd Quarter
3rd Quarter
4th Quarter
Revenues
22 737
5 473
5 691
5 810
5 763
Gross profit
5 567
1 356
1 384
1 424
1 403
Gross margin
24.5%
24.8%
24.3%
24.5%
24.3%
Selling, general and administrative expenses
(4 871)
(1 211)
(1 232)
(1 222)
(1 206)
as a percentage of revenues
21.4%
22.1%
21.6%
21.0%
20.9%
Operating profit (loss)
390
32
177
231
(50)
Operating margin
1.7%
0.6%
3.1%
4.0%
(0.9%)
Net profit (loss) from continuing operations
125
(2)
86
192
(151)
Group share in net profit (loss)
105
(3)
87
189
(168)
Group share in net profit (loss) per share:
Basic
1.05
(0.02)
0.86
1.88
(1.67)
Diluted
1.04
(0.02)
0.86
1.87
(1.66)
2011(1)
Full Year
1st Quarter
2nd Quarter
3rd Quarter
4th Quarter
Revenues
21 110
5 044
5 107
5 325
5 634
Gross profit
5 361
1 290
1 280
1 350
1 441
Gross margin
25.4%
25.6%
25.1%
25.3%
25.6%
Selling, general and administrative expenses
(4 497)
(1 090)
(1 089)
(1 126)
(1 192)
as a percentage of revenues
21.3%
21.6%
21.3%
21.1%
21.2%
Operating profit
813
218
209
239
147
Operating margin
3.9%
4.3%
4.1%
4.5%
2.6%
Net profit from continuing operations
477
126
117
134
100
Group share in net profit
475
126
117
133
99
Group share in net profit per share:
Basic
4.71
1.25
1.16
1.32
0.98
Diluted
4.68
1.24
1.15
1.31
0.98
2010
Full Year
1st Quarter
2nd Quarter
3rd Quarter
4th Quarter
Revenues
20 850
4 971
5 329
5 307
5 243
Gross profit
5 353
1 275
1 357
1 364
1 357
Gross margin
25.7%
25.7%
25.5%
25.7%
25.9%
Selling, general and administrative expenses
(4 394)
(1 056)
(1 148)
(1 127)
(1 063)
as a percentage of revenues
21.1%
21.2%
21.5%
21.2%
20.3%
Operating profit
1 024
241
227
249
307
Operating margin
4.9%
4.8%
4.3%
4.7%
5.9%
Net profit from continuing operations
576
130
115
141
190
Group share in net profit
574
130
114
140
190
Group share in net profit per share:
Basic
5.73
1.29
1.15
1.40
1.88
Diluted
5.68
1.28
1.13
1.39
1.87
_____________
(1) 2012 and 2011 was adjusted for the reclassification of the Albanian operations to discontinued operations.