Food Lion 2012 Annual Report Download - page 137
Download and view the complete annual report
Please find page 137 of the 2012 Food Lion annual report below. You can navigate through the pages in the report by either clicking on the pages listed below, or by using the keyword search tool below to find specific information within the annual report.-
 1
1 -
2
-
3
-
4
-
5
-
6
-
7
-
8
-
9
-
10
-
11
-
12
-
13
-
14
-
15
-
16
-
17
-
18
-
19
-
20
-
21
-
22
-
23
-
24
-
25
-
26
-
27
-
28
-
29
-
30
-
31
-
32
-
33
-
34
-
35
-
36
-
37
-
38
-
39
-
40
-
41
-
42
-
43
-
44
-
45
-
46
-
47
-
48
-
49
-
50
-
51
-
52
-
53
-
54
-
55
-
56
-
57
-
58
-
59
-
60
-
61
-
62
-
63
-
64
-
65
-
66
-
67
-
68
-
69
-
70
-
71
-
72
-
73
-
74
-
75
-
76
-
77
-
78
-
79
-
80
-
81
-
82
-
83
-
84
-
85
-
86
-
87
-
88
-
89
-
90
-
91
-
92
-
93
-
94
-
95
-
96
-
97
-
98
-
99
-
100
-
101
-
102
-
103
-
104
-
105
-
106
-
107
-
108
-
109
-
110
-
111
-
112
-
113
-
114
-
115
-
116
-
117
-
118
-
119
-
120
-
121
-
122
-
123
-
124
-
125
-
126
-
 127
127 -
 128
128 -
 129
129 -
 130
130 -
 131
131 -
 132
132 -
 133
133 -
 134
134 -
 135
135 -
 136
136 -
 137
137 -
 138
138 -
 139
139 -
 140
140 -
 141
141 -
 142
142 -
 143
143 -
 144
144 -
 145
145 -
 146
146 -
 147
147 -
148
-
149
-
150
-
151
-
152
-
153
-
154
-
155
-
156
-
157
-
158
-
159
-
160
-
161
-
162
-
163
-
164
-
165
-
166
-
167
-
168
-
169
-
170
-
171
-
172
-
173
-
174
-
175
-
176
 |
 |

DELHAIZE GROUP FINANCIAL STATEMENTS’12 // 135
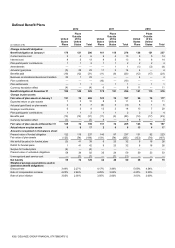
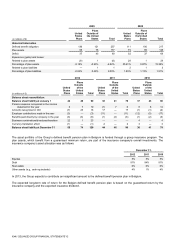
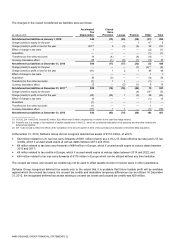
The Hannaford plan asset allocation was as follows:
December 31,
2012
2011
2010
Equities
0%
49%
66%
Debt
95%
49%
32%
Other assets (e.g., cash equivalents)
5%
2%
2%
In 2012, Delhaize America performed a review of the plan’s funding position and the investment policy applied by the plan.
Following the closure of the plan, the Group’s exposure to continuously growing defined benefit obligations has decreased and
Delhaize America changed the investment strategy of the plan and intends to invest going forward mainly in debt securities.
The 2012 year-end actuarial calculation resulted in a benefit to the Group and due to the improved funding position Delhaize
Group expects that only insignificant contribution will be made to the plan during 2013.
Total defined benefit expenses in profit or loss equal €10 million, €6 million and €14 million for 2012, 2011 and 2010,
respectively, and can be summarized as follows:
(in millions of €)
2012
2011
2010
Cost of sales
1
2
2
Selling, general and administrative expenses
9
4
12
Total defined benefit expense recognized in profit or loss
10
6
14
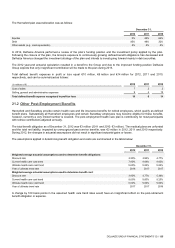
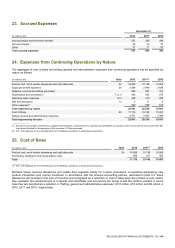
21.2 Other Post-Employment Benefits
Hannaford and Sweetbay provide certain health care and life insurance benefits for retired employees, which qualify as defined
benefit plans. Substantially all Hannaford employees and certain Sweetbay employees may become eligible for these benefits,
however, currently a very limited number is covered. The post-employment health care plan is contributory for most participants
with retiree contributions adjusted annually.
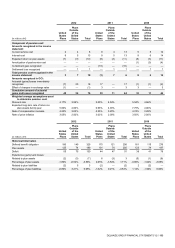
The total benefit obligation as of December 31, 2012 was €3 million (2011 and 2010: €3 million). The medical plans are unfunded
and the total net liability, impacted by unrecognized past service benefits, was €3 million in 2012, 2011 and 2010 respectively.
During 2012, the changes in actuarial assumptions did not result in significant actuarial gains or losses.
The assumptions applied in determining benefit obligation and costs are summarized in the table below:
December 31,
2012
2011
2010
Weighted-average actuarial assumptions used to determine benefit obligations:
Discount rate
3.30%
3.80%
4.77%
Current health care cost trend
7.80%
9.09%
9.00%
Ultimate health care cost trend
5.00%
5.00%
5.00%
Year of ultimate trend rate
2018
2017
2017
Weighted-average actuarial assumptions used to determine benefit cost:
Discount rate
3.80%
4.77%
5.38%
Current health care cost trend
9.09%
9.00%
9.25%
Ultimate health care cost trend
5.00%
5.00%
5.00%
Year of ultimate trend rate
2017
2017
2016
A change by 100 basis points in the assumed health care trend rates would have an insignificant effect on the post-retirement
benefit obligation or expense.