Food Lion 2012 Annual Report Download - page 173
Download and view the complete annual report
Please find page 173 of the 2012 Food Lion annual report below. You can navigate through the pages in the report by either clicking on the pages listed below, or by using the keyword search tool below to find specific information within the annual report.-
 1
1 -
2
-
3
-
4
-
5
-
6
-
7
-
8
-
9
-
10
-
11
-
12
-
13
-
14
-
15
-
16
-
17
-
18
-
19
-
20
-
21
-
22
-
23
-
24
-
25
-
26
-
27
-
28
-
29
-
30
-
31
-
32
-
33
-
34
-
35
-
36
-
37
-
38
-
39
-
40
-
41
-
42
-
43
-
44
-
45
-
46
-
47
-
48
-
49
-
50
-
51
-
52
-
53
-
54
-
55
-
56
-
57
-
58
-
59
-
60
-
61
-
62
-
63
-
64
-
65
-
66
-
67
-
68
-
69
-
70
-
71
-
72
-
73
-
74
-
75
-
76
-
77
-
78
-
79
-
80
-
81
-
82
-
83
-
84
-
85
-
86
-
87
-
88
-
89
-
90
-
91
-
92
-
93
-
94
-
95
-
96
-
97
-
98
-
99
-
100
-
101
-
102
-
103
-
104
-
105
-
106
-
107
-
108
-
109
-
110
-
111
-
112
-
113
-
114
-
115
-
116
-
117
-
118
-
119
-
120
-
121
-
122
-
123
-
124
-
125
-
126
-
127
-
128
-
129
-
130
-
131
-
132
-
133
-
134
-
135
-
136
-
137
-
138
-
139
-
140
-
141
-
142
-
143
-
144
-
145
-
146
-
147
-
148
-
149
-
150
-
151
-
152
-
153
-
154
-
155
-
156
-
157
-
158
-
159
-
160
-
161
-
162
-
 163
163 -
 164
164 -
 165
165 -
 166
166 -
 167
167 -
 168
168 -
 169
169 -
 170
170 -
 171
171 -
 172
172 -
 173
173 -
 174
174 -
 175
175 -
 176
176
 |
 |

DELHAIZE GROUP ANNUAL REPORT ‘12 // 171
mation with the SEC. The reports and
other information Delhaize Group
files with the SEC can be inspected
at the SEC’s public reference room
located at 100 F Street, N.E., Wash-
ington, D.C., U.S. 20549. You may
obtain information on the opera-
tion of the SEC’s public reference
room by calling the SEC at +1 (800)
SEC-0330. Also, the SEC maintains
a website at www.sec.gov that con-
tains reports and other information
that registrants have filed electroni-
cally with the SEC.
Delhaize Group makes available
free of charge, through the share-
holder information section of Delhaize
Group’s website (www.delhaizegroup.
com), the Company’s reports filed
electronically with the SEC pursuant to
the Exchange Act as soon as reason-
ably practicable after the Company
electronically files such material with
the SEC.
Delhaize Group’s reports and other
information can also be inspected
and copied at the offices of the New
York Stock Exchange, Inc., 20 Broad
Street, New York, NY 10005, U.S.A.
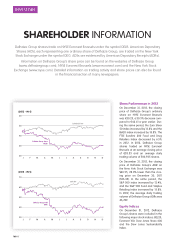
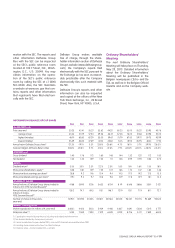
INFORMATION DELHAIZE GROUP SHARE
2012 2011 2010 2009 2008 2007 2006 2005 2004 2003
SHARE PRICE (in €)
Price: year-end 30.25 43.41 55.27 53.62 44.20 60.20 63.15 55.20 55.95 40.78
average (close) 33.33 51.29 57.24 49.26 46.37 67.38 58.14 51.68 44.98 28.15
highest (intraday) 46.91 60.80 67.29 55.00 59.67 75.79 67.00 59.70 59.75 43.99
lowest (intraday) 25.59 40.82 47.69 42.81 32.80 54.5 49.12 45.95 36.61 11.90
Annual return Delhaize Group share
(1)
-27.3% -19.1% 5.3% 23.8% -26.6% -4.7% 16.1% 0.7% 39.9% 136.3%
Evolution Belgian All Shares Return index 18.80% -20.8% 2.7% 31.6% -47.6% -1.9% +26.2% +28.1% +38.2% +16.0%
DIVIDEND (in €)
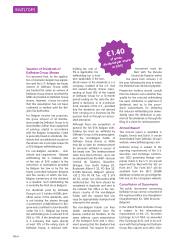
Gross dividend 1.40 1.76 1.72 1.60 1.48 1.44 1.32 1.20 1.12 1.00
Net dividend 1.05 1.32 1.29 1.20 1.11 1.08 0.99 0.90 0.84 0.75
RATIOS
Dividend return
(2)
3.5% 3.0% 2.3% 2.2% 2.5% 1.8% 1.6% 1.6% 1.5% 1.8%
Share price/shareholders' equity
(3)
0,58 0.81 1.09 1.22 1.07 1.66 1.73 1.47 1.84 1.36
Share price/basic earnings per share
(3)
28,8 9.2 9.6 10.4 9.4 14.3 17.0 14.2 17.5 13.5
Share price/diluted earnings per share
(3)
29,1 9.3 9.7 10.6 9.6 14.9 17.8 14.9 18.1 13.5
NUMBER OF SHARES
Annual volume of Delhaize Group shares traded (in
millions of €; NYSE Euronext Brussels)
(4)
4 188 3 895 5 216 5 633 6 754 8 141 6 548 3 686 3 581 2 021
Annual volume of Delhaize Group shares traded (in
millions of shares;
NYSE Euronext Brussel)
(4)
128.2 74.7 89.3 115.1 146.7 121.9 113.1 71.9 81.1 72.7
Number of shares (in thousands;
year-end)
101 921 101 892 101 555 100 871 100 583 100 281 96 457 94 705 93 669 92 625
MARKET CAPITALIZATION
Market capitalization (in millions of €; year-end) 3 083.1 4 423 5 613 5 409 4 446 6 037 6 091 5 228 5 241 3 777
Enterprise value
(3) (5)
5 144 7 069 7 400 7 472 6 849 8 281 8 726 8 171 7 849 6 805
(1) Capital gains recorded during the year, including net dividend and reinvestment.
(2) Net dividend divided by share price at year-end.
(3) Cannot be calculated for years before 2003, since no IFRS financials are available before 2003.
(4) Excluding shares traded on the New York Stock Exchange.
(5) Enterprise value = market capitalization + net debt.
Ordinary Shareholders’
Meeting
The next Ordinary Shareholders’
Meeting will take place on Thursday,
May 23, 2013. Detailed information
about the Ordinary Shareholders’
Meeting will be published in the
Belgian newspapers L’Echo and De
Tijd, as well as in the Belgian Official
Gazette and on the Company web-
site.