Food Lion 2012 Annual Report Download - page 158
Download and view the complete annual report
Please find page 158 of the 2012 Food Lion annual report below. You can navigate through the pages in the report by either clicking on the pages listed below, or by using the keyword search tool below to find specific information within the annual report.-
 1
1 -
2
-
3
-
4
-
5
-
6
-
7
-
8
-
9
-
10
-
11
-
12
-
13
-
14
-
15
-
16
-
17
-
18
-
19
-
20
-
21
-
22
-
23
-
24
-
25
-
26
-
27
-
28
-
29
-
30
-
31
-
32
-
33
-
34
-
35
-
36
-
37
-
38
-
39
-
40
-
41
-
42
-
43
-
44
-
45
-
46
-
47
-
48
-
49
-
50
-
51
-
52
-
53
-
54
-
55
-
56
-
57
-
58
-
59
-
60
-
61
-
62
-
63
-
64
-
65
-
66
-
67
-
68
-
69
-
70
-
71
-
72
-
73
-
74
-
75
-
76
-
77
-
78
-
79
-
80
-
81
-
82
-
83
-
84
-
85
-
86
-
87
-
88
-
89
-
90
-
91
-
92
-
93
-
94
-
95
-
96
-
97
-
98
-
99
-
100
-
101
-
102
-
103
-
104
-
105
-
106
-
107
-
108
-
109
-
110
-
111
-
112
-
113
-
114
-
115
-
116
-
117
-
118
-
119
-
120
-
121
-
122
-
123
-
124
-
125
-
126
-
127
-
128
-
129
-
130
-
131
-
132
-
133
-
134
-
135
-
136
-
137
-
138
-
139
-
140
-
141
-
142
-
143
-
144
-
145
-
146
-
147
-
 148
148 -
 149
149 -
 150
150 -
 151
151 -
 152
152 -
 153
153 -
 154
154 -
 155
155 -
 156
156 -
 157
157 -
 158
158 -
 159
159 -
 160
160 -
 161
161 -
 162
162 -
 163
163 -
 164
164 -
 165
165 -
 166
166 -
 167
167 -
 168
168 -
169
-
170
-
171
-
172
-
173
-
174
-
175
-
176
 |
 |

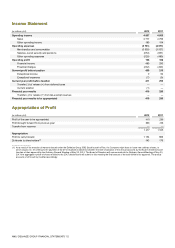
156 // DELHAIZE GROUP FINANCIAL STATEMENTS’12
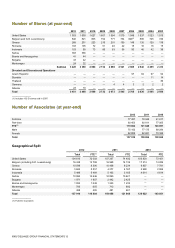
Number of Stores (at year-end)
2012
2011
2010
2009
2008
2007
2006
2005
2004
2003
United States
1 553
1 650
1 627
1 607
1 594
1 570
1 549
1 537
1 523
1 515
Belgium and G.D. Luxembourg
840
821
805
792
771
734
840(1)
806
745
726
Greece
268
251
223
216
201
159
148
135
129
119
Romania
193
105
72
51
40
22
18
16
16
15
Indonesia
103
89
73
66
63
56
50
46
42
38
Serbia
363
366
—
—
—
—
—
—
—
—
Bosnia and Herzegovina
41
44
—
—
—
—
—
—
—
—
Bulgaria
43
42
—
—
—
—
—
—
—
—
Montenegro
24
22
—
—
—
—
—
—
—
—
Subtotal
3 428
3 390
2 800
2 732
2 669
2 541
2 605
2 540
2 455
2 413
Divested and Discontinued Operations
Czech Republic
—
—
—
—
—
—
97
94
97
94
Slovakia
—
—
—
—
—
—
—
—
11
14
Thailand
—
—
—
—
—
—
—
—
—
36
Germany
—
—
—
—
4
4
3
2
2
2
Albania
23
18
—
—
—
—
—
—
—
—
Total
3 451
3 408
2 800
2 732
2 673
2 545
2 705
2 636
2 565
2 559
_____________
(1) Includes 132 Di stores sold in 2007.
Number of Associates (at year-end)
2012
2011
2010
Full-time
77 457
78 945
61 617
Part-time
80 453
80 911
77 005
FTE(1)
119 804
121 648
103 051
Male
75 102
77 175
68 294
Female
82 808
82 681
70 328
Total
157 910
159 856
138 622
Geographical Split
2012
2011
2010
Total
FTE(1)
Total
FTE
Total
FTE
United States
104 613
72 003
107 237
74 492
103 839
73 451
Belgium (including G.D. Luxembourg)
16 438
13 708
16 968
14 139
17 314
14 289
Greece
10 599
8 306
10 438
8 234
9 857
7 791
Romania
5 693
5 557
4 277
4 167
2 998
2 906
Indonesia
5 489
5 489
5 165
5 165
4 614
4 614
Serbia
10 860
10 646
10 890
10 621
—
—
Bulgaria
1 971
1 907
2 442
2 425
—
—
Bosnia and Herzegovina
1 053
1 048
1 245
1 232
—
—
Montenegro
706
655
713
692
—
—
Albania
488
485
481
481
—
—
Total
157 910
119 804
159 856
121 648
138 622
103 051
_____________
(1) Full-time equivalent.