Food Lion 2012 Annual Report Download - page 151
Download and view the complete annual report
Please find page 151 of the 2012 Food Lion annual report below. You can navigate through the pages in the report by either clicking on the pages listed below, or by using the keyword search tool below to find specific information within the annual report.-
 1
1 -
2
-
3
-
4
-
5
-
6
-
7
-
8
-
9
-
10
-
11
-
12
-
13
-
14
-
15
-
16
-
17
-
18
-
19
-
20
-
21
-
22
-
23
-
24
-
25
-
26
-
27
-
28
-
29
-
30
-
31
-
32
-
33
-
34
-
35
-
36
-
37
-
38
-
39
-
40
-
41
-
42
-
43
-
44
-
45
-
46
-
47
-
48
-
49
-
50
-
51
-
52
-
53
-
54
-
55
-
56
-
57
-
58
-
59
-
60
-
61
-
62
-
63
-
64
-
65
-
66
-
67
-
68
-
69
-
70
-
71
-
72
-
73
-
74
-
75
-
76
-
77
-
78
-
79
-
80
-
81
-
82
-
83
-
84
-
85
-
86
-
87
-
88
-
89
-
90
-
91
-
92
-
93
-
94
-
95
-
96
-
97
-
98
-
99
-
100
-
101
-
102
-
103
-
104
-
105
-
106
-
107
-
108
-
109
-
110
-
111
-
112
-
113
-
114
-
115
-
116
-
117
-
118
-
119
-
120
-
121
-
122
-
123
-
124
-
125
-
126
-
127
-
128
-
129
-
130
-
131
-
132
-
133
-
134
-
135
-
136
-
137
-
138
-
139
-
140
-
 141
141 -
 142
142 -
 143
143 -
 144
144 -
 145
145 -
 146
146 -
 147
147 -
 148
148 -
 149
149 -
 150
150 -
 151
151 -
 152
152 -
 153
153 -
 154
154 -
 155
155 -
 156
156 -
 157
157 -
 158
158 -
 159
159 -
 160
160 -
 161
161 -
162
-
163
-
164
-
165
-
166
-
167
-
168
-
169
-
170
-
171
-
172
-
173
-
174
-
175
-
176
 |
 |

DELHAIZE GROUP FINANCIAL STATEMENTS’12 // 149
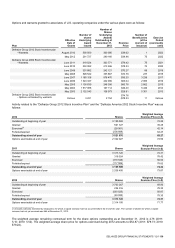
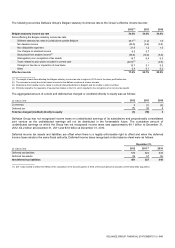
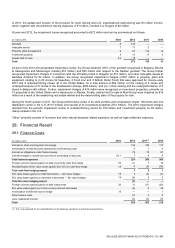
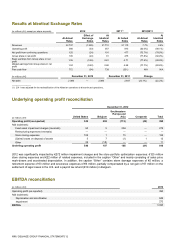
Basic and diluted earnings per share for 2012, 2011 and 2010 were as follows:
(in millions of €, except numbers of shares and earnings per share)
2012
2011(1)
2010
Net profit from continuing operations
125
477
576
Net profit (loss) from continuing operations attributable to non-controlling interests
(2)
—
1
Group share in net profit from continuing operations
127
477
575
Result from discontinued operations, net of tax
(22)
(2)
(1)
Group share in net profit for diluted earnings
105
475
574
Weighted average number of ordinary shares outstanding
100 777 257
100 683 828
100 270 861
Adjusted for dilutive effect of share-based awards
356 326
742 075
888 825
Weighted average number of diluted ordinary shares outstanding
101 133 583
101 425 903
101 159 686
Basic earnings per ordinary share (in €):
From continuing operations
1.27
4.74
5.74
From discontinued operations
(0.22)
(0.03)
(0.01)
Basic EPS attributable to the equity holders of the Group
1.05
4.71
5.73
Diluted earnings per ordinary share (in €):
From continuing operations
1.26
4.70
5.69
From discontinued operations
(0.22)
(0.02)
(0.01)
Diluted EPS attributable to the equity holders of the Group
1.04
4.68
5.68
_______________
(1) 2011 was adjusted for the reclassification of the Albanian operations to discontinued operations..
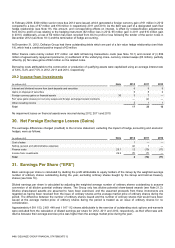
32. Related Party Transactions
Several of the Group’s subsidiaries provide post-employment benefit plans for the benefit of employees of the Group. Payments
made to these plans and receivables from and payables to these plans are disclosed in Note 21.
The Company’s Remuneration Policy for Directors and the Executive Management can be found as Exhibit E to the Corporate
Governance Charter posted on the Company’s website at www.delhaizegroup.com.
Compensation of Directors
The individual Directors’ remuneration granted for the fiscal years 2012, 2011 and 2010 is set forth in the “Corporate
Governance” section of this annual report. The total remuneration of Directors is as follows, gross before deduction of
withholding taxes:
(in thousands of €)
2012
2011
2010
Total remuneration non-executive Directors
998
1 049
1 000
Executive Director
Pierre-Olivier Beckers(1)
80
80
80
Total
1 078
1 129
1 080
(1) The amounts solely relate to the remuneration of the Executive Director and exclude his compensation as CEO.