Food Lion 2012 Annual Report Download - page 170
Download and view the complete annual report
Please find page 170 of the 2012 Food Lion annual report below. You can navigate through the pages in the report by either clicking on the pages listed below, or by using the keyword search tool below to find specific information within the annual report.-
 1
1 -
2
-
3
-
4
-
5
-
6
-
7
-
8
-
9
-
10
-
11
-
12
-
13
-
14
-
15
-
16
-
17
-
18
-
19
-
20
-
21
-
22
-
23
-
24
-
25
-
26
-
27
-
28
-
29
-
30
-
31
-
32
-
33
-
34
-
35
-
36
-
37
-
38
-
39
-
40
-
41
-
42
-
43
-
44
-
45
-
46
-
47
-
48
-
49
-
50
-
51
-
52
-
53
-
54
-
55
-
56
-
57
-
58
-
59
-
60
-
61
-
62
-
63
-
64
-
65
-
66
-
67
-
68
-
69
-
70
-
71
-
72
-
73
-
74
-
75
-
76
-
77
-
78
-
79
-
80
-
81
-
82
-
83
-
84
-
85
-
86
-
87
-
88
-
89
-
90
-
91
-
92
-
93
-
94
-
95
-
96
-
97
-
98
-
99
-
100
-
101
-
102
-
103
-
104
-
105
-
106
-
107
-
108
-
109
-
110
-
111
-
112
-
113
-
114
-
115
-
116
-
117
-
118
-
119
-
120
-
121
-
122
-
123
-
124
-
125
-
126
-
127
-
128
-
129
-
130
-
131
-
132
-
133
-
134
-
135
-
136
-
137
-
138
-
139
-
140
-
141
-
142
-
143
-
144
-
145
-
146
-
147
-
148
-
149
-
150
-
151
-
152
-
153
-
154
-
155
-
156
-
157
-
158
-
159
-
 160
160 -
 161
161 -
 162
162 -
 163
163 -
 164
164 -
 165
165 -
 166
166 -
 167
167 -
 168
168 -
 169
169 -
 170
170 -
 171
171 -
 172
172 -
 173
173 -
 174
174 -
 175
175 -
 176
176
 |
 |

168 //
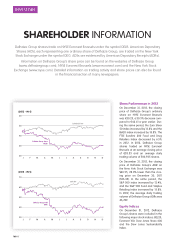
INVESTORS
SHAREHOLDER INFORMATION
Share Performance in 2012
On December 31, 2012, the closing
price of Delhaize Group’s ordinary
share on NYSE Euronext Brussels
was €30.25, a 30.3% decrease com-
pared to €43.41 a year earlier. Dur-
ing the same period, the Euro Stoxx
50 index increased by 13.8% and the
Bel20 index increased by 18.8%. The
FTSE Eurofi rst 300 Food and Drug
Retailers Index decreased by 6.5%
in 2012. In 2012, Delhaize Group
shares traded on NYSE Euronext
Brussels at an average closing price
of €33.33 and an average daily
trading volume of 500,935 shares.
On December 31, 2012, the closing
price of Delhaize Group’s ADR on
the New York Stock Exchange was
$40.55, 28.0% lower than the clos-
ing price on December 30, 2011
($56.35). In the same period, the
S&P 500 index increased by 13.4%,
and the S&P 500 Food and Staples
Retailing Index increased by 15.8%.
In 2012, the average daily trading
volume of Delhaize Group ADRs was
46,789.
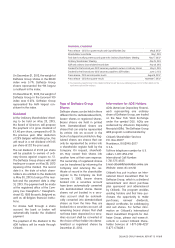
Equity Indices
On December 31, 2012, Delhaize
Group’s shares were included in the
following major stock indices: BEL20,
Euronext 100, Dow Jones Stoxx 600
and the Dow Jones Sustainability
Index.
Delhaize Group shares trade on NYSE Euronext Brussels under the symbol DELB. American Depositary
Shares (ADS), each representing one ordinary share of Delhaize Group, are traded on the New York
Stock Exchange under the symbol DEG. ADSs are evidenced by American Depositary Receipts (ADRs).
Information on Delhaize Group’s share price can be found on the websites of Delhaize Group
(www.delhaizegroup.com), NYSE Euronext Brussels (www.euronext.com) and the New York Stock
Exchange (www.nyse.com). Detailed information on trading activity and share prices can also be found
in the fi nancial section of many newspapers.
60
50
40
30
20
J F M A M J J A S O N D
(2012 - IN €)
Delhaize Group share
(DELB)
EURONEXT 100
70
60
50
40
30
J F M A M J J A S O N D
(2012 - IN $)
Delhaize Group ADR
(DEG)
S&P 500