Food Lion 2012 Annual Report Download - page 160
Download and view the complete annual report
Please find page 160 of the 2012 Food Lion annual report below. You can navigate through the pages in the report by either clicking on the pages listed below, or by using the keyword search tool below to find specific information within the annual report.-
 1
1 -
2
-
3
-
4
-
5
-
6
-
7
-
8
-
9
-
10
-
11
-
12
-
13
-
14
-
15
-
16
-
17
-
18
-
19
-
20
-
21
-
22
-
23
-
24
-
25
-
26
-
27
-
28
-
29
-
30
-
31
-
32
-
33
-
34
-
35
-
36
-
37
-
38
-
39
-
40
-
41
-
42
-
43
-
44
-
45
-
46
-
47
-
48
-
49
-
50
-
51
-
52
-
53
-
54
-
55
-
56
-
57
-
58
-
59
-
60
-
61
-
62
-
63
-
64
-
65
-
66
-
67
-
68
-
69
-
70
-
71
-
72
-
73
-
74
-
75
-
76
-
77
-
78
-
79
-
80
-
81
-
82
-
83
-
84
-
85
-
86
-
87
-
88
-
89
-
90
-
91
-
92
-
93
-
94
-
95
-
96
-
97
-
98
-
99
-
100
-
101
-
102
-
103
-
104
-
105
-
106
-
107
-
108
-
109
-
110
-
111
-
112
-
113
-
114
-
115
-
116
-
117
-
118
-
119
-
120
-
121
-
122
-
123
-
124
-
125
-
126
-
127
-
128
-
129
-
130
-
131
-
132
-
133
-
134
-
135
-
136
-
137
-
138
-
139
-
140
-
141
-
142
-
143
-
144
-
145
-
146
-
147
-
148
-
149
-
 150
150 -
 151
151 -
 152
152 -
 153
153 -
 154
154 -
 155
155 -
 156
156 -
 157
157 -
 158
158 -
 159
159 -
 160
160 -
 161
161 -
 162
162 -
 163
163 -
 164
164 -
 165
165 -
 166
166 -
 167
167 -
 168
168 -
 169
169 -
 170
170 -
171
-
172
-
173
-
174
-
175
-
176
 |
 |

158 // DELHAIZE GROUP FINANCIAL STATEMENTS’12
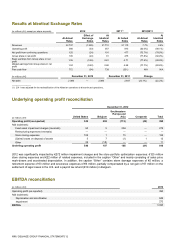
Results at Identical Exchange Rates
(in millions of €, except per share amounts)
2012
2011(1)
2012/2011
At Actual
Rates
Effect of
Exchange
Rates
At
Identical
Rates
At Actual
Rates
At Actual
Rates
At
Identical
Rates
Revenues
22 737
(1 025)
21 712
21 110
7.7%
2.9%
Operating profit
390
(33)
357
813
(52.0%)
(56.1%)
Net profit from continuing operations
125
(24)
101
477
(73.7%)
(78.9%)
Group share in net profit
105
(24)
81
475
(77.8%)
(82.9%)
Basic earnings from Group share in net
profit
1.05
(0.24)
0.81
4.71
(77.8%)
(82.9%)
Diluted earnings from Group share in net
profit
1.04
(0.24)
0.80
4.68
(77.7%)
(82.8%)
Free cash flow
772
(34)
738
(231)
N/A
N/A
(in millions of €)
December 31, 2012
December 31, 2011
Change
Net debt
2 060
—
2 060
2 647
(22.1%)
(22.2%)
_____________
(1) 2011 was adjusted for the reclassification of the Albanian operations to discontinued operations..
Underlying operating profit reconciliation
December 31, 2012
(in millions of €)
United States
Belgium
Southeastern
Europe and
Asia
Corporate
Total
Operating profit (as reported)
343
202
(113)
(42)
390
Add (substract):
Fixed asset impairment charges (reversals)
63
5
204
—
272
Restructuring expenses (reversals)
—
—
—
—
—
Store closing expenses
109
1
15
—
125
(Gains) losses on disposal of assets
5
7
(1)
1
12
Other
29
(18)
—
—
11
Underling operating profit
549
197
105
(41)
810
2012 was significantly impacted by €272 million impairment charges and the store portfolio optimization expenses: €125 million
store closing expenses and €22 million of related expenses, included in the caption “Other” and mainly consisting of sales price
mark-downs and accelerated depreciation. In addition, the caption “Other” contains storm damage expenses of €5 million, a
retirement expense of €3 million and severance expenses of €6 million, partially compensated by a net gain of €7 million on the
settlement of legal cases in the U.S. and a payroll tax refund (€18 million) in Belgium.
EBITDA reconciliation
(in millions of €)
2012
Operating profit (as reported)
390
Add (substract):
Depreciation and amortization
649
Impairment
272
EBITDA
1 311