Food Lion 2012 Annual Report Download - page 134
Download and view the complete annual report
Please find page 134 of the 2012 Food Lion annual report below. You can navigate through the pages in the report by either clicking on the pages listed below, or by using the keyword search tool below to find specific information within the annual report.-
 1
1 -
2
-
3
-
4
-
5
-
6
-
7
-
8
-
9
-
10
-
11
-
12
-
13
-
14
-
15
-
16
-
17
-
18
-
19
-
20
-
21
-
22
-
23
-
24
-
25
-
26
-
27
-
28
-
29
-
30
-
31
-
32
-
33
-
34
-
35
-
36
-
37
-
38
-
39
-
40
-
41
-
42
-
43
-
44
-
45
-
46
-
47
-
48
-
49
-
50
-
51
-
52
-
53
-
54
-
55
-
56
-
57
-
58
-
59
-
60
-
61
-
62
-
63
-
64
-
65
-
66
-
67
-
68
-
69
-
70
-
71
-
72
-
73
-
74
-
75
-
76
-
77
-
78
-
79
-
80
-
81
-
82
-
83
-
84
-
85
-
86
-
87
-
88
-
89
-
90
-
91
-
92
-
93
-
94
-
95
-
96
-
97
-
98
-
99
-
100
-
101
-
102
-
103
-
104
-
105
-
106
-
107
-
108
-
109
-
110
-
111
-
112
-
113
-
114
-
115
-
116
-
117
-
118
-
119
-
120
-
121
-
122
-
123
-
 124
124 -
 125
125 -
 126
126 -
 127
127 -
 128
128 -
 129
129 -
 130
130 -
 131
131 -
 132
132 -
 133
133 -
 134
134 -
 135
135 -
 136
136 -
 137
137 -
 138
138 -
 139
139 -
 140
140 -
 141
141 -
 142
142 -
 143
143 -
 144
144 -
145
-
146
-
147
-
148
-
149
-
150
-
151
-
152
-
153
-
154
-
155
-
156
-
157
-
158
-
159
-
160
-
161
-
162
-
163
-
164
-
165
-
166
-
167
-
168
-
169
-
170
-
171
-
172
-
173
-
174
-
175
-
176
 |
 |

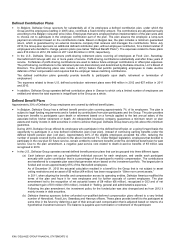
132 // DELHAIZE GROUP FINANCIAL STATEMENTS’12
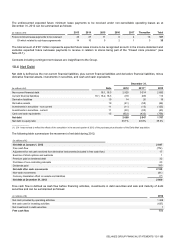
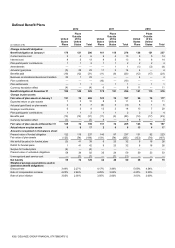
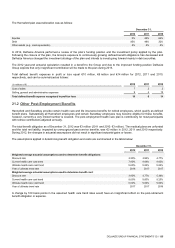
Defined Benefit Plans
(in millions of €)
2012
2011
2010
United
States
Plans
Plans
Outside
of the
United
States
Total
United
States
Plans
Plans
Outside
of the
United
States
Total
United
States
Plans
Plans
Outside
of the
United
States
Total
Change in benefit obligation:
Benefit obligation at January 1
175
121
296
161
115
276
136
121
257
Current service cost
2
4
6
9
4
13
9
5
14
Interest cost
8
5
13
8
5
13
8
6
14
Plan participants’ contributions
1
1
2
1
1
2
2
2
4
Amendments
—
—
—
—
1
1
(1)
(3)
(4)
Actuarial (gain)/loss
(5)
28
23
11
3
14
4
—
4
Benefits paid
(19)
(12)
(31)
(11)
(9)
(20)
(12)
(17)
(29)
Business combinations/divestures/ transfers
22
1
23
—
—
—
4
—
4
Plan curtailments
—
—
—
(10)
—
(10)
—
—
—
Plan settlements
—
1
1
—
1
1
—
1
1
Currency translation effect
(4)
—
(4)
6
—
6
11
—
11
Benefit obligation at December 31
180
149
329
175
121
296
161
115
276
Change in plan assets:
Fair value of plan assets at January 1
131
74
205
123
74
197
99
78
177
Expected return on plan assets
7
3
10
8
3
11
8
3
11
Actuarial gain/(loss) on plan assets
2
5
7
(6)
3
(3)
5
1
6
Employer contributions
6
3
9
12
2
14
13
7
20
Plan participants’ contributions
1
1
2
1
1
2
2
2
4
Benefits paid
(19)
(12)
(31)
(11)
(9)
(20)
(12)
(17)
(29)
Currency translation effect
(3)
—
(3)
4
—
4
8
—
8
Fair value of plan assets at December 31
125
74
199
131
74
205
123
74
197
Actual return on plan assets
9
8
17
2
6
8
13
4
17
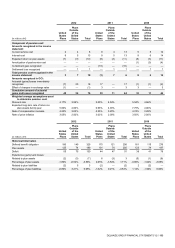
Amounts recognized in the balance sheet:
Present value of funded obligation
122
115
237
140
97
237
131
92
223
Fair value of plan assets
(125)
(74)
(199)
(131)
(74)
(205)
(123)
(74)
(197)
Net deficit/(surplus) for funded plans
(3)
41
38
9
23
32
8
18
26
Deficit for funded plans
1
41
42
9
23
32
8
18
26
Surplus for funded plans
(4)
—
(4)
—
—
—
—
—
—
Present value of unfunded obligations
58
34
92
35
24
59
30
23
53
Unrecognized past service cost
—
(1)
(1)
—
(1)
(1)
—
—
—
Net liability
55
74
129
44
46
90
38
41
79
Weighted average assumptions used to
determine benefit obligations:
Discount rate
3.49%
2.27%
4.17%
3.99%
5.00%
4.54%
Rate of compensation increase
4.25%
2.66%
4.25%
3.02%
4.25%
3.20%
Rate of price inflation
3.05%
2.00%
3.05%
2.00%
3.03%
2.00%