Food Lion 2012 Annual Report Download - page 54
Download and view the complete annual report
Please find page 54 of the 2012 Food Lion annual report below. You can navigate through the pages in the report by either clicking on the pages listed below, or by using the keyword search tool below to find specific information within the annual report.-
 1
1 -
2
-
3
-
4
-
5
-
6
-
7
-
8
-
9
-
10
-
11
-
12
-
13
-
14
-
15
-
16
-
17
-
18
-
19
-
20
-
21
-
22
-
23
-
24
-
25
-
26
-
27
-
28
-
29
-
30
-
31
-
32
-
33
-
34
-
35
-
36
-
37
-
38
-
39
-
40
-
41
-
42
-
43
-
 44
44 -
 45
45 -
 46
46 -
 47
47 -
 48
48 -
 49
49 -
 50
50 -
 51
51 -
 52
52 -
 53
53 -
 54
54 -
 55
55 -
 56
56 -
 57
57 -
 58
58 -
 59
59 -
 60
60 -
 61
61 -
 62
62 -
 63
63 -
 64
64 -
65
-
66
-
67
-
68
-
69
-
70
-
71
-
72
-
73
-
74
-
75
-
76
-
77
-
78
-
79
-
80
-
81
-
82
-
83
-
84
-
85
-
86
-
87
-
88
-
89
-
90
-
91
-
92
-
93
-
94
-
95
-
96
-
97
-
98
-
99
-
100
-
101
-
102
-
103
-
104
-
105
-
106
-
107
-
108
-
109
-
110
-
111
-
112
-
113
-
114
-
115
-
116
-
117
-
118
-
119
-
120
-
121
-
122
-
123
-
124
-
125
-
126
-
127
-
128
-
129
-
130
-
131
-
132
-
133
-
134
-
135
-
136
-
137
-
138
-
139
-
140
-
141
-
142
-
143
-
144
-
145
-
146
-
147
-
148
-
149
-
150
-
151
-
152
-
153
-
154
-
155
-
156
-
157
-
158
-
159
-
160
-
161
-
162
-
163
-
164
-
165
-
166
-
167
-
168
-
169
-
170
-
171
-
172
-
173
-
174
-
175
-
176
 |
 |

52 //
GOVERNANCE
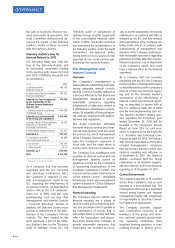
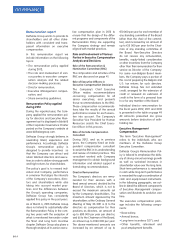
Base
Salary(1) CEO Other Members
of Executive
Management(2)
(in millions of €)
Payout Number of
persons Payout
2010 0.95 72.73
2011 0.97 62.54
2012 0.97 83.28
2013 0.97 63.10
(1) Amounts are gross amounts before deduction of
withholding taxes and social security levy. They
do not include the compensation of the CEO as
director of the Company.
(2) For 2010 these numbers include the pro-rata share
of compensation of Rick Anicetti who left
the Company on May 21, 2010. 2012 includes the
pro-rata share of compensation for Pierre Bouchut
and Roland Smith who joined the company in
2012.
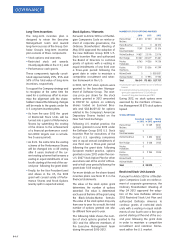
In 2012, the CEO and the members
of the Executive Management have
recommended to the Board of Direc-
tors, who agreed, to maintain their
base salary unchanged, thereby
also excluding automatic indexa-
tion (Belgium) or, where applicable,
cost of life adjustment.
For 2013 the CEO and the mem-
bers of the Executive Management
(with the exception of one person
whose geographical responsi-
bilities have been substantially
altered) have recommended
to the Board of Directors, who
agreed, to maintain their base
salary unchanged, thereby also
excluding automatic indexation
(Belgium) or, where applicable,
cost of life adjustment.
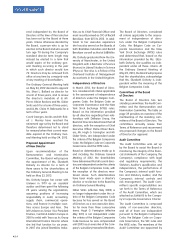
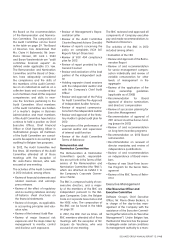
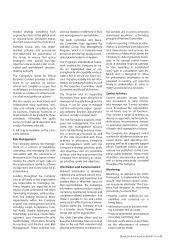
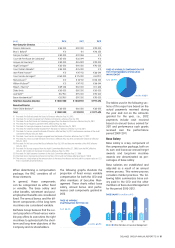
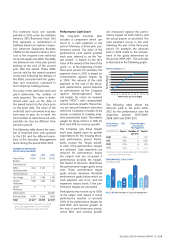
The following graphs illustrate the
split of the variable remuneration
paid per component for the CEO
and other members of Executive
Management.
VARIABLE COMPENSATION CEO BY
COMPONENT (in millions of €)
0.68 0.74
10
0.66 0.38
11
0.39 0.76
12 13
LTI - Performance
Cash grants
Annual Bonus
0.39 0.58
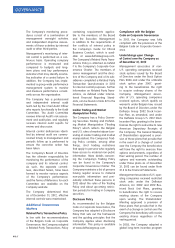
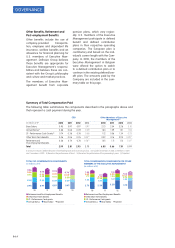
VARIABLE COMPENSATION OTHER
MEMBERS OF EXECUTIVE MANAGEMENT
BY COMPONENT (in millions of €)
1.63 1.12
10
1.29 0.56
11
1.01 1.34
12 13
LTI - Performance
Cash grants
Annual Bonus
1.04 0.73
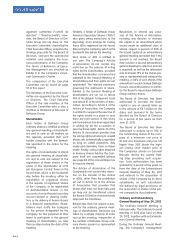
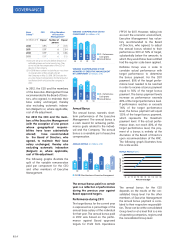
Annual Bonus
The annual bonus rewards short-
term performance of the Executive
Management. The annual bonus is
a cash award for achieving perfor-
mance goals related to the individ-
ual and the Company. The annual
bonus is a variable part of executive
compensation.
ANNUAL BONUS (in millions of €)
10
0.68
1.63
11
0.66
1.29
12
0.39
1.01
13
0.39
1.04
CEO Other Members of Executive Management
The annual bonus paid in a certain
year is a reflection of performance
during the previous year against
Board approved targets.
Performance during 2011
The target bonus for the current year
is expressed as a percentage of the
annual base salary of the individual
for that year. The annual bonus paid
in 2012 was based on the perfor-
mance against Board approved
targets for Profit from Operations
(“PFO”) for 2011. However, taking into
account the economic environment,
Executive Management has volun-
tary recommended to the Board
of Directors, who agreed, to adjust
the annual bonus related to their
performance 2011 at 50% of target,
substantially below the amounts to
which they would have been entitled
had the regular scale been applied.
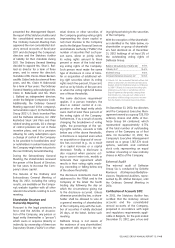
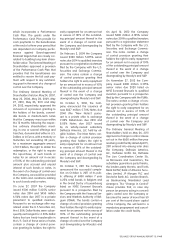
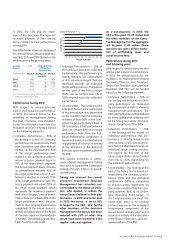
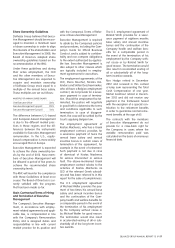
Delhaize Group uses a scale to
correlate actual performance with
target performance to determine
the bonus payment. For the 2011
payment, 80% of the target perfor-
mance level needed to be reached
in order to receive a bonus payment
equal to 50% of the target bonus
payment. The bonus payment levels
increase as performance exceeds
80% of the target performance level.
If performance reaches or exceeds
110% of the target performance
level, the bonus payment will equal
125% of the target bonus payment,
which represents the maximum
payment level. If the actual perfor-
mance does not reach 80% of the
target performance level, the pay-
ment of a bonus is entirely at the
discretion of the Board of Directors
upon recommendation of the RNC.
The following graph illustrates how
this scale works.
BONUS PAYOUT (in%)
Funding Percent
Percent to Budget
140
120
100
80
60
40
20
0
50 60 70 80 90 100 110 120 130 140 150
The annual bonus for the CEO
depends on the results at the con-
solidated Group level. For the other
members of Executive Management
the annual bonus payment is corre-
lated to their respective responsibili-
ties. These can be at the consolidated
Group level or at a level that is a mix
of operating companies, regions and
the consolidated Group level.