Food Lion 2012 Annual Report Download - page 103
Download and view the complete annual report
Please find page 103 of the 2012 Food Lion annual report below. You can navigate through the pages in the report by either clicking on the pages listed below, or by using the keyword search tool below to find specific information within the annual report.-
 1
1 -
2
-
3
-
4
-
5
-
6
-
7
-
8
-
9
-
10
-
11
-
12
-
13
-
14
-
15
-
16
-
17
-
18
-
19
-
20
-
21
-
22
-
23
-
24
-
25
-
26
-
27
-
28
-
29
-
30
-
31
-
32
-
33
-
34
-
35
-
36
-
37
-
38
-
39
-
40
-
41
-
42
-
43
-
44
-
45
-
46
-
47
-
48
-
49
-
50
-
51
-
52
-
53
-
54
-
55
-
56
-
57
-
58
-
59
-
60
-
61
-
62
-
63
-
64
-
65
-
66
-
67
-
68
-
69
-
70
-
71
-
72
-
73
-
74
-
75
-
76
-
77
-
78
-
79
-
80
-
81
-
82
-
83
-
84
-
85
-
86
-
87
-
88
-
89
-
90
-
91
-
92
-
 93
93 -
 94
94 -
 95
95 -
 96
96 -
 97
97 -
 98
98 -
 99
99 -
 100
100 -
 101
101 -
 102
102 -
 103
103 -
 104
104 -
 105
105 -
 106
106 -
 107
107 -
 108
108 -
 109
109 -
 110
110 -
 111
111 -
 112
112 -
 113
113 -
114
-
115
-
116
-
117
-
118
-
119
-
120
-
121
-
122
-
123
-
124
-
125
-
126
-
127
-
128
-
129
-
130
-
131
-
132
-
133
-
134
-
135
-
136
-
137
-
138
-
139
-
140
-
141
-
142
-
143
-
144
-
145
-
146
-
147
-
148
-
149
-
150
-
151
-
152
-
153
-
154
-
155
-
156
-
157
-
158
-
159
-
160
-
161
-
162
-
163
-
164
-
165
-
166
-
167
-
168
-
169
-
170
-
171
-
172
-
173
-
174
-
175
-
176
 |
 |

DELHAIZE GROUP FINANCIAL STATEMENTS ’12 // 101
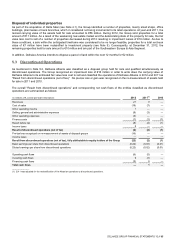
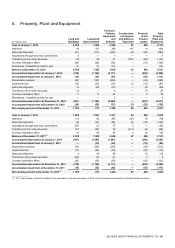
8. Property, Plant and Equipment
(in millions of €)
Land and
Buildings
Leasehold
Improvements
Furniture,
Fixtures,
Equipment
and
Vehicles
Construction
in Progress
and Advance
Payments
Property
under
Finance
Leases
Total
Property,
Plant and
Equipment
Cost at January 1, 2012
2 539
1 902
3 624
87
969
9 121
Additions
96
101
246
147
14
604
Sales and disposals
(21)
(110)
(228)
(4)
(26)
(389)
Acquisitions through business combinations
3
—
1
—
—
4
Transfers (to) from other accounts
29
56
41
(187)
(86)
(147)
Currency translation effect
(49)
(28)
(56)
—
(15)
(148)
Divestitures / Classified as held for sale
(1)
(1)
(12)
—
—
(14)
Balance at December 31, 2012
2 596
1 920
3 616
43
856
9 031
Accumulated depreciation at January 1, 2012
(735)
(1 126)
(2 117)
—
(422)
(4 400)
Accumulated impairment at January 1, 2012
(19)
(35)
(62)
—
(55)
(171)
Depreciation expense
(93)
(132)
(294)
—
(49)
(568)
Impairment loss
(15)
(23)
(36)
(1)
(12)
(87)
Sales and disposals
14
109
210
—
25
358
Transfers to (from) other accounts
10
1
4
—
78
93
Currency translation effect
11
17
34
—
8
70
Divestitures / Classified as held for sale
—
—
5
—
—
5
Accumulated depreciation at December 31, 2012
(801)
(1 160)
(2 203)
—
(407)
(4 571)
Accumulated impairment at December 31, 2012
(26)
(29)
(53)
(1)
(20)
(129)
Net carrying amount at December 31, 2012
1 769
731
1 360
42
429
4 331
Cost at January 1, 2011
1 930
1 861
3 217
94
930
8 032
Additions
112
92
265
204
35
708
Sales and disposals
(8)
(22)
(96)
(5)
(18)
(149)
Acquisitions through business combinations
297
21
77
5
—
400
Transfers (to) from other accounts
167
(90)
76
(213)
(6)
(66)
Currency translation effect
41
40
85
2
28
196
Balance at December 31, 2011(1)
2 539
1 902
3 624
87
969
9 121
Accumulated depreciation at January 1, 2011
(587)
(1 055)
(1 881)
—
(380)
(3 903)
Accumulated impairment at January 1, 2011
—
(12)
(23)
—
(19)
(54)
Depreciation expense
(74)
(126)
(264)
—
(49)
(513)
Impairment loss
(17)
(24)
(39)
—
(35)
(115)
Sales and disposals
4
20
89
—
19
132
Transfers to (from) other accounts
(60)
65
(3)
—
3
5
Currency translation effect
(20)
(29)
(58)
—
(16)
(123)
Accumulated depreciation at December 31, 2011
(735)
(1 126)
(2 117)
—
(422)
(4 400)
Accumulated impairment at December 31, 2011
(19)
(35)
(62)
—
(55)
(171)
Net carrying amount at December 31, 2011(1)
1 785
741
1 445
87
492
4 550
_______________
(1) 2011 was revised to reflect the effects of the completion in the second quarter of 2012 of the purchase price allocation of the Delta Maxi acquisition.