Food Lion 2012 Annual Report Download - page 121
Download and view the complete annual report
Please find page 121 of the 2012 Food Lion annual report below. You can navigate through the pages in the report by either clicking on the pages listed below, or by using the keyword search tool below to find specific information within the annual report.-
 1
1 -
2
-
3
-
4
-
5
-
6
-
7
-
8
-
9
-
10
-
11
-
12
-
13
-
14
-
15
-
16
-
17
-
18
-
19
-
20
-
21
-
22
-
23
-
24
-
25
-
26
-
27
-
28
-
29
-
30
-
31
-
32
-
33
-
34
-
35
-
36
-
37
-
38
-
39
-
40
-
41
-
42
-
43
-
44
-
45
-
46
-
47
-
48
-
49
-
50
-
51
-
52
-
53
-
54
-
55
-
56
-
57
-
58
-
59
-
60
-
61
-
62
-
63
-
64
-
65
-
66
-
67
-
68
-
69
-
70
-
71
-
72
-
73
-
74
-
75
-
76
-
77
-
78
-
79
-
80
-
81
-
82
-
83
-
84
-
85
-
86
-
87
-
88
-
89
-
90
-
91
-
92
-
93
-
94
-
95
-
96
-
97
-
98
-
99
-
100
-
101
-
102
-
103
-
104
-
105
-
106
-
107
-
108
-
109
-
110
-
 111
111 -
 112
112 -
 113
113 -
 114
114 -
 115
115 -
 116
116 -
 117
117 -
 118
118 -
 119
119 -
 120
120 -
 121
121 -
 122
122 -
 123
123 -
 124
124 -
 125
125 -
 126
126 -
 127
127 -
 128
128 -
 129
129 -
 130
130 -
 131
131 -
132
-
133
-
134
-
135
-
136
-
137
-
138
-
139
-
140
-
141
-
142
-
143
-
144
-
145
-
146
-
147
-
148
-
149
-
150
-
151
-
152
-
153
-
154
-
155
-
156
-
157
-
158
-
159
-
160
-
161
-
162
-
163
-
164
-
165
-
166
-
167
-
168
-
169
-
170
-
171
-
172
-
173
-
174
-
175
-
176
 |
 |
DELHAIZE GROUP FINANCIAL STATEMENTS ’12 // 119
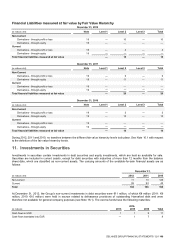
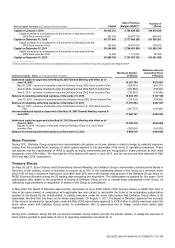
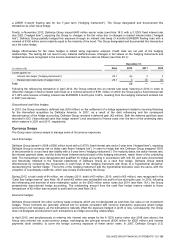
(€9 million) and $13 million (€10 million), respectively, were recorded in investment in securities on the balance sheet (see Note
11).
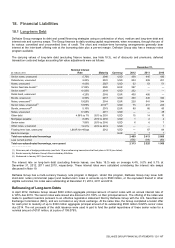
Long-term Debt by Currency, Contractually Agreed Payments and Fair values
The main currencies in which Delhaize Group’s long-term (excluding finance leases, see Note 18.3) debt are denominated are as
follows:
December 31,
(in millions of €)
2012
2011
2010
U.S. dollar
1 362
1 391
1 381
Euro
1 107
1 022
625
Total
2 469
2 413
2 006
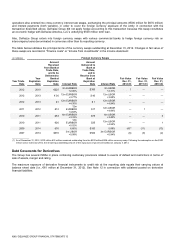
The following table summarizes the contractually agreed (undiscounted) interest payments and repayments of principals of
Delhaize Group’s non-derivative financial liabilities, excluding any hedging effects and not taking premiums and discounts into
account:
(in millions of $)
2013
2014
2015
2016
2017
Thereafter
Fair Value
Fixed rates
Notes due 2014, redeemed in
2013
99
—
—
—
—
—
105
Average interest rate
5.88%
—
—
—
—
—
Interest due
2
—
—
—
—
—
Bonds due 2017
—
—
—
—
450
—
513
Average interest rate
—
—
—
—
6.50%
—
Interest due
29
29
29
29
15
—
Notes due 2019
—
—
—
—
—
300
310
Average interest rate
—
—
—
—
—
4.13%
Interest due
12
12
12
12
12
19
Notes due 2027
—
—
—
—
—
71
82
Average interest rate
—
—
—
—
—
8.05%
Interest due
6
6
6
6
6
54
Debentures due 2031
—
—
—
—
—
270
323
Average interest rate
—
—
—
—
—
9.00%
Interest due
24
24
24
24
24
330
Notes due 2040
—
—
—
—
—
827
806
Average interest rate
—
—
—
—
—
5.70%
Interest due
47
47
47
47
47
1 084
Senior and other notes
—
—
—
9
—
—
10
Average interest rate
—
—
—
7.06%
—
—
Interest due
1
1
1
—
—
—
Mortgage payable
—
—
—
2
—
—
2
Average interest rate
—
—
—
8.25%
—
—
Interest due
—
—
—
—
—
—
Other debt
1
12
—
—
—
7
20
Average interest rate
2.88%
5.36%
—
—
—
4.50%
Interest due
1
1
—
—
—
4
Total $ cash flows
222
132
119
129
554
2 966
2 171
Total cash flows translated
in millions of €
168
100
90
98
420
2 248
1 645