Food Lion 2012 Annual Report Download - page 32
Download and view the complete annual report
Please find page 32 of the 2012 Food Lion annual report below. You can navigate through the pages in the report by either clicking on the pages listed below, or by using the keyword search tool below to find specific information within the annual report.-
 1
1 -
2
-
3
-
4
-
5
-
6
-
7
-
8
-
9
-
10
-
11
-
12
-
13
-
14
-
15
-
16
-
17
-
18
-
19
-
20
-
21
-
 22
22 -
 23
23 -
 24
24 -
 25
25 -
 26
26 -
 27
27 -
 28
28 -
 29
29 -
 30
30 -
 31
31 -
 32
32 -
 33
33 -
 34
34 -
 35
35 -
 36
36 -
 37
37 -
 38
38 -
 39
39 -
 40
40 -
 41
41 -
 42
42 -
43
-
44
-
45
-
46
-
47
-
48
-
49
-
50
-
51
-
52
-
53
-
54
-
55
-
56
-
57
-
58
-
59
-
60
-
61
-
62
-
63
-
64
-
65
-
66
-
67
-
68
-
69
-
70
-
71
-
72
-
73
-
74
-
75
-
76
-
77
-
78
-
79
-
80
-
81
-
82
-
83
-
84
-
85
-
86
-
87
-
88
-
89
-
90
-
91
-
92
-
93
-
94
-
95
-
96
-
97
-
98
-
99
-
100
-
101
-
102
-
103
-
104
-
105
-
106
-
107
-
108
-
109
-
110
-
111
-
112
-
113
-
114
-
115
-
116
-
117
-
118
-
119
-
120
-
121
-
122
-
123
-
124
-
125
-
126
-
127
-
128
-
129
-
130
-
131
-
132
-
133
-
134
-
135
-
136
-
137
-
138
-
139
-
140
-
141
-
142
-
143
-
144
-
145
-
146
-
147
-
148
-
149
-
150
-
151
-
152
-
153
-
154
-
155
-
156
-
157
-
158
-
159
-
160
-
161
-
162
-
163
-
164
-
165
-
166
-
167
-
168
-
169
-
170
-
171
-
172
-
173
-
174
-
175
-
176
 |
 |
30 //
REVIEW
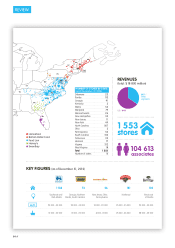
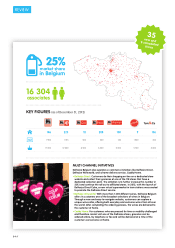
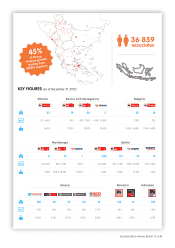
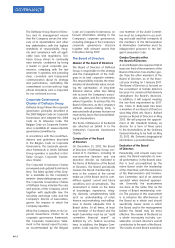
KEY FIGURES (as of December 31, 2012)
1 138 73 56 181 105
v
Southeast and
Mid-Atlantic
Georgia, Northern
Florida, South Carolina
New Jersey, Ohio,
Pennsylvania
Northeast Westcoast
of Florida
sq.ft.
25 000 - 45 000 25 000 - 45 000 18 000 - 20 000 25 000 - 55 000 25 000 - 50 000
15 000 - 20 000 15 000 - 20 000 6 000 - 8 000 25 000 - 46 000 28 000 - 42 000
NUMBER OF STORES BY STATE
(as of December 31, 2012)
Delaware
23
Florida
113
Georgia
91
Kentucky
3
Maine
56
Maryland
79
Massachusetts
26
New Hampshire
33
New Jersey
11
New York
49
North Carolina
507
Ohio
3
Pennsylvania
50
South Carolina
130
Tennessee
32
Vermont
17
Virginia
312
West Virginia
18
Total
1 553
Number of states
18
104 613
1 553
associates
stores
REVENUES
(total: $ 18 800 million)
36% /
Other
segments
US / 64%
Hannaford
Bottom Dollar Food
Food Lion
Harvey’s
Sweetbay