Cincinnati Bell 2012 Annual Report Download - page 74
Download and view the complete annual report
Please find page 74 of the 2012 Cincinnati Bell annual report below. You can navigate through the pages in the report by either clicking on the pages listed below, or by using the keyword search tool below to find specific information within the annual report.-
 1
1 -
2
-
3
-
4
-
5
-
6
-
7
-
8
-
9
-
10
-
11
-
12
-
13
-
14
-
15
-
16
-
17
-
18
-
19
-
20
-
21
-
22
-
23
-
24
-
25
-
26
-
27
-
28
-
29
-
30
-
31
-
32
-
33
-
34
-
35
-
36
-
37
-
38
-
39
-
40
-
41
-
42
-
43
-
44
-
45
-
46
-
47
-
48
-
49
-
50
-
51
-
52
-
53
-
54
-
55
-
56
-
57
-
58
-
59
-
60
-
61
-
62
-
63
-
 64
64 -
 65
65 -
 66
66 -
 67
67 -
 68
68 -
 69
69 -
 70
70 -
 71
71 -
 72
72 -
 73
73 -
 74
74 -
 75
75 -
 76
76 -
 77
77 -
 78
78 -
 79
79 -
 80
80 -
 81
81 -
 82
82 -
 83
83 -
 84
84 -
85
-
86
-
87
-
88
-
89
-
90
-
91
-
92
-
93
-
94
-
95
-
96
-
97
-
98
-
99
-
100
-
101
-
102
-
103
-
104
-
105
-
106
-
107
-
108
-
109
-
110
-
111
-
112
-
113
-
114
-
115
-
116
-
117
-
118
-
119
-
120
-
121
-
122
-
123
-
124
-
125
-
126
-
127
-
128
-
129
-
130
-
131
-
132
-
133
-
134
-
135
-
136
-
137
-
138
-
139
-
140
-
141
-
142
-
143
-
144
-
145
-
146
-
147
-
148
-
149
-
150
-
151
-
152
-
153
-
154
-
155
-
156
-
157
-
158
-
159
-
160
-
161
-
162
-
163
-
164
-
165
-
166
-
167
-
168
-
169
-
170
-
171
-
172
-
173
-
174
-
175
-
176
-
177
-
178
-
179
-
180
-
181
-
182
-
183
-
184
-
185
-
186
-
187
-
188
-
189
-
190
-
191
-
192
-
193
-
194
-
195
-
196
-
197
-
198
-
199
-
200
-
201
-
202
-
203
-
204
-
205
-
206
-
207
-
208
-
209
-
210
-
211
-
212
-
213
-
214
-
215
-
216
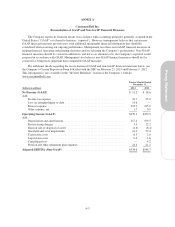
 |
 |

(dollars in millions)
Twelve Months Ended
December 31, 2012
Reconciliation of Operating Cash Flow (GAAP) to Adjusted Unlevered Operating
Cash Flows (Non-GAAP):
Operating cash flow (GAAP) .................................................. $212.7
Interest payments ........................................................... 217.9
Unlevered operating cash flows (Non-GAAP) 430.6
Add:
Transaction costs ....................................................... 6.3
Adjusted unlevered operating cash flows (Non-GAAP) ........................... $436.9
Twelve Months Ended
December 31,
(dollars in millions) 2012 2011
Reconciliation of GAAP Cash Flow to Free Cash Flow (as defined by the Company)
Net decrease in cash and cash equivalents ..................................... $ (50.1) $ (3.6)
Less adjustments:
Proceeds from issuance of long-term debt ..................................... (525.0) —
Increase in corporate credit and receivables facilities ............................. (52.0) (0.4)
Repayment of debt ........................................................ 442.4 11.5
Debt issuance costs ....................................................... 20.9 0.8
Common stock repurchase .................................................. 0.3 10.4
Proceeds from sale of assets, net of expenses ................................... (1.6) (10.8)
Transaction costs ......................................................... 11.0 2.6
Free cash flow (as defined by the Company) ................................... $(154.1) $ 10.5
Adjusted EBITDA provides a useful measure of operational performance. The Company defines Adjusted
EBITDA as GAAP operating income plus depreciation, amortization, restructuring charges, asset impairments,
components of pension and other retirement plan costs related to interest costs, asset returns, and amortization of
actuarial gains and losses, and other special items.
Free Cash Flow provides a useful measure of operational performance, liquidity and financial health. The
Company defines free cash flow as cash provided by (used in) operating, financing and investing activities,
adjusted for the issuance and repayment of debt, debt issuance costs, the repurchase of common stock, and the
proceeds from the sale or the use of funds from the purchase of business operations, including transaction costs.
Free cash flow should not be considered as an alternative to net income (loss), operating income (loss), cash flow
from operating activities, or the change in cash on the balance sheet and may not be comparable with free cash
flow as defined by other companies. Although the Company feels that there is no comparable GAAP measure for
free cash flow, the foregoing financial information reconciles free cash flow to the net increase (decrease) in cash
and cash equivalents.
Unlevered Operating Cash Flow provides a useful measure of operational performance and liquidity. The
Company defines unlevered operating cash flow as cash flows provided by (used in) operating activities plus
cash paid for interest and other special items.
A-2