Cincinnati Bell 2012 Annual Report Download - page 110
Download and view the complete annual report
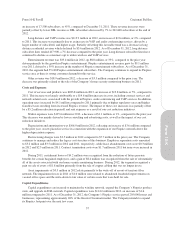
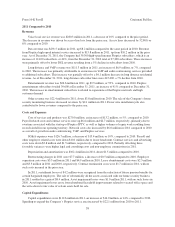
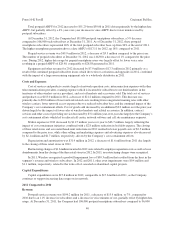
Please find page 110 of the 2012 Cincinnati Bell annual report below. You can navigate through the pages in the report by either clicking on the pages listed below, or by using the keyword search tool below to find specific information within the annual report.
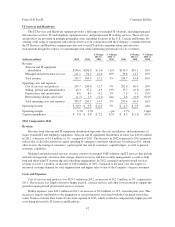
Wireline continued
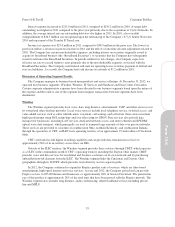
(dollars in millions, except for operating metrics) 2012 2011
$ Change
2012 vs.
2011
% Change
2012 vs.
2011 2010
$ Change
2011 vs.
2010
% Change
2011 vs.
2010
Revenue:
Voice — local service ............. $255.4 $280.3 $(24.9) (9)% $311.9 $(31.6) (10)%
Data ........................... 306.9 291.5 15.4 5% 283.3 8.2 3%
Long distance and VoIP ........... 113.9 111.3 2.6 2% 104.4 6.9 7%
Entertainment ................... 35.4 26.6 8.8 33% 16.7 9.9 59%
Other .......................... 18.9 22.4 (3.5) (16)% 26.2 (3.8) (15)%
Total revenue .................... 730.5 732.1 (1.6) 0% 742.5 (10.4) (1)%
Operating costs and expenses:
Cost of services and products ....... 283.8 270.0 13.8 5% 256.8 13.2 5%
Selling, general and administrative . . . 125.6 126.7 (1.1) (1)% 140.1 (13.4) (10)%
Depreciation and amortization ...... 106.0 102.4 3.6 4% 103.9 (1.5) (1)%
Restructuring charges ............. 3.5 7.7 (4.2) (55)% 8.2 (0.5) (6)%
Curtailment loss .................. — 4.2 (4.2) n/m — 4.2 n/m
Gain on sale or disposal of assets .... (1.8) (8.4) 6.6 79% — (8.4) n/m
Asset impairments ................ 0.5 1.0 (0.5) (50)% — 1.0 n/m
Total operating costs and expenses . . . 517.6 503.6 14.0 3% 509.0 (5.4) (1)%
Operating income .................. $212.9 $228.5 $(15.6) (7)% $233.5 $ (5.0) (2)%
Operating margin ................... 29.1% 31.2% (2.1)pts 31.4% (0.2)pts
Capital expenditures ................ $114.2 $112.6 $1.6 1% $ 98.6 $ 14.0 14%
Metrics information (in thousands):
Local access lines ................ 573.9 621.3 (47.4) (8)% 674.1 (52.8) (8)%
High-speed internet subscribers
DSL subscribers ................ 202.6 218.0 (15.4) (7)% 228.9 (10.9) (5)%
Fioptics internet subscribers ...... 56.8 39.3 17.5 45% 27.2 12.1 44%
259.4 257.3 2.1 1% 256.1 1.2 0%
Long distance lines ............... 417.9 447.4 (29.5) (7)% 482.8 (35.4) (7)%
Fioptics entertainment subscribers . . . 55.1 39.6 15.5 39% 28.1 11.5 41%
2012 Compared to 2011
Revenues
Voice local service revenue includes local service, value added services, digital trunking, switched access,
and information services. Voice local service revenue was $255.4 million in 2012, down $24.9 million, or 9%,
compared to 2011. The decrease in revenue is primarily due to fewer local access lines compared to a year ago.
Access lines within the segment’s ILEC territory decreased by 41,400, or 7%, to 511,000 at December 31, 2012
from 552,400 at December 31, 2011. The Company had 62,900 CLEC access lines at December 31, 2012
compared to 68,900 access lines at December 31, 2011. The segment continues to lose access lines as a result of,
among other factors, customers electing to solely use wireless service in lieu of traditional local wireline service,
Company-initiated disconnections of customers with credit problems, and customers electing to use service from
other providers.
Data revenue consists of Fioptics and DSL high-speed internet access, data transport, and LAN
interconnection services. Data revenue was $306.9 million in 2012, up $15.4 million, or 5%, compared to 2011.
Data transport and LAN services increased by $13.0 million, or 7%, year-over-year primarily as a result of
increased demand by business customers for higher speed connections. Revenue from Fioptics high-speed
internet service increased to $18.1 million in 2012, up from $12.5 million in the prior year due to increased
subscribers. As of December 31, 2012, the Company had 56,800 high-speed internet Fioptics customers, which is
36
Form 10-K Part II Cincinnati Bell Inc.


