Cincinnati Bell 2012 Annual Report Download - page 133
Download and view the complete annual report
Please find page 133 of the 2012 Cincinnati Bell annual report below. You can navigate through the pages in the report by either clicking on the pages listed below, or by using the keyword search tool below to find specific information within the annual report.-
 1
1 -
2
-
3
-
4
-
5
-
6
-
7
-
8
-
9
-
10
-
11
-
12
-
13
-
14
-
15
-
16
-
17
-
18
-
19
-
20
-
21
-
22
-
23
-
24
-
25
-
26
-
27
-
28
-
29
-
30
-
31
-
32
-
33
-
34
-
35
-
36
-
37
-
38
-
39
-
40
-
41
-
42
-
43
-
44
-
45
-
46
-
47
-
48
-
49
-
50
-
51
-
52
-
53
-
54
-
55
-
56
-
57
-
58
-
59
-
60
-
61
-
62
-
63
-
64
-
65
-
66
-
67
-
68
-
69
-
70
-
71
-
72
-
73
-
74
-
75
-
76
-
77
-
78
-
79
-
80
-
81
-
82
-
83
-
84
-
85
-
86
-
87
-
88
-
89
-
90
-
91
-
92
-
93
-
94
-
95
-
96
-
97
-
98
-
99
-
100
-
101
-
102
-
103
-
104
-
105
-
106
-
107
-
108
-
109
-
110
-
111
-
112
-
113
-
114
-
115
-
116
-
117
-
118
-
119
-
120
-
121
-
122
-
 123
123 -
 124
124 -
 125
125 -
 126
126 -
 127
127 -
 128
128 -
 129
129 -
 130
130 -
 131
131 -
 132
132 -
 133
133 -
 134
134 -
 135
135 -
 136
136 -
 137
137 -
 138
138 -
 139
139 -
 140
140 -
 141
141 -
 142
142 -
 143
143 -
144
-
145
-
146
-
147
-
148
-
149
-
150
-
151
-
152
-
153
-
154
-
155
-
156
-
157
-
158
-
159
-
160
-
161
-
162
-
163
-
164
-
165
-
166
-
167
-
168
-
169
-
170
-
171
-
172
-
173
-
174
-
175
-
176
-
177
-
178
-
179
-
180
-
181
-
182
-
183
-
184
-
185
-
186
-
187
-
188
-
189
-
190
-
191
-
192
-
193
-
194
-
195
-
196
-
197
-
198
-
199
-
200
-
201
-
202
-
203
-
204
-
205
-
206
-
207
-
208
-
209
-
210
-
211
-
212
-
213
-
214
-
215
-
216
 |
 |

Form 10-K Part II Cincinnati Bell Inc.
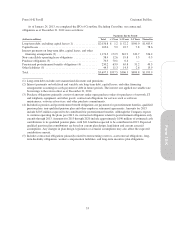
Reviewing the Carrying Values of Long-Lived Assets — Depreciation of our Wireline telephone plant is
determined on a straight-line basis using the group depreciation method. Depreciation of other property, except
for leasehold improvements, is based on the straight-line method over the estimated economic useful life.
Depreciation of leasehold improvements is based on a straight-line method over the lesser of the economic useful
life or term of the lease, including option renewal periods if renewal of the lease is reasonably assured. Repair
and maintenance expense items are charged to expense as incurred.
The useful lives of plant and equipment are estimated in order to determine the amount of depreciation
expense to be recorded during any reporting period. The majority of Wireline’s plant and equipment is
depreciated using the group method, which develops a depreciation rate annually based on the average useful life
of a specific group of assets rather than for each individual asset as would be utilized under the unit method. The
estimated life of the group changes as the composition of the group of assets and their related lives change. Such
estimated life of the group is based on historical experience with similar assets, as well as taking into account
anticipated technological or other changes.
If technological changes were to occur more rapidly than anticipated, the useful lives assigned to these
assets may need to be shortened, resulting in the recognition of increased depreciation expense in future periods.
Likewise, if the anticipated technological or other changes occur more slowly than expected, the life of the group
could be extended based on the life assigned to new assets added to the group. This could result in a reduction of
depreciation expense in future periods. Competition from new or more cost effective technologies could affect
our ability to generate cash flow from our network-based services. This competition could ultimately result in an
impairment of certain of our tangible or intangible assets. This could have a substantial impact on our future
operating results. A one-year change in the useful life of these assets would increase or decrease annual
depreciation expense by approximately $30 million.
Management reviews the carrying value of long-lived assets, other than goodwill and indefinite-lived
intangible assets discussed above, when events or changes in circumstances indicate that the carrying amount of
the assets may not be recoverable. An impairment loss is recognized when the estimated future undiscounted
cash flows expected to result from the use of an asset (or group of assets) and its eventual disposition is less than
its carrying amount. An impairment loss is measured as the amount by which the asset’s carrying value exceeds
its estimated fair value.
In 2012, management identified impairment indicators for a customer relationship intangible and long-lived
assets primarily associated with the 2007 GramTel acquisition. We performed step one of the impairment tests
utilizing cash flow projections from our most recent long-term business plan and other updated assumptions.
Management engaged a third-party valuation specialist to assist with the Company’s estimation of the fair value
of these assets.
Management estimated the fair value of the customer relationship using the income approach, which
discounted the expected earnings attributable to current customer contracts, and included estimates of future
expenses, capital expenditures and a discount rate of 12%. Management estimated the fair value of the customer
relationship intangible to be $2.8 million, resulting in an asset impairment of $1.5 million. The fair value of other
long-lived assets, primarily leasehold improvements, was estimated at $2.4 million, resulting in an impairment
loss of $11.8 million. Both fair value estimates are deemed Level 3 measurements within the fair value hierarchy
due to the significance of unobservable inputs utilized in these measurements. For the year ended December 31,
2012, impairment losses of $13.3 million were recognized in the Data Center Colocation segment.
During 2012, management also identified impairment indicators for an out-of-territory fiber network.
Management estimated the fair value of this asset using an income approach which discounted the expected
earnings attributable to current customer contracts, and included estimates of future expenses and a discount rate
of 12%. The fair value of this asset was estimated at $0.4 million, resulting in an impairment loss of $0.5 million.
This fair value estimate was deemed a Level 3 measurement within the fair value hierarchy due to the
significance of unobservable inputs utilized in these measurements. This impairment loss was recognized in the
59
Form 10-K