Cincinnati Bell 2012 Annual Report Download - page 106
Download and view the complete annual report
Please find page 106 of the 2012 Cincinnati Bell annual report below. You can navigate through the pages in the report by either clicking on the pages listed below, or by using the keyword search tool below to find specific information within the annual report.-
 1
1 -
2
-
3
-
4
-
5
-
6
-
7
-
8
-
9
-
10
-
11
-
12
-
13
-
14
-
15
-
16
-
17
-
18
-
19
-
20
-
21
-
22
-
23
-
24
-
25
-
26
-
27
-
28
-
29
-
30
-
31
-
32
-
33
-
34
-
35
-
36
-
37
-
38
-
39
-
40
-
41
-
42
-
43
-
44
-
45
-
46
-
47
-
48
-
49
-
50
-
51
-
52
-
53
-
54
-
55
-
56
-
57
-
58
-
59
-
60
-
61
-
62
-
63
-
64
-
65
-
66
-
67
-
68
-
69
-
70
-
71
-
72
-
73
-
74
-
75
-
76
-
77
-
78
-
79
-
80
-
81
-
82
-
83
-
84
-
85
-
86
-
87
-
88
-
89
-
90
-
91
-
92
-
93
-
94
-
95
-
 96
96 -
 97
97 -
 98
98 -
 99
99 -
 100
100 -
 101
101 -
 102
102 -
 103
103 -
 104
104 -
 105
105 -
 106
106 -
 107
107 -
 108
108 -
 109
109 -
 110
110 -
 111
111 -
 112
112 -
 113
113 -
 114
114 -
 115
115 -
 116
116 -
117
-
118
-
119
-
120
-
121
-
122
-
123
-
124
-
125
-
126
-
127
-
128
-
129
-
130
-
131
-
132
-
133
-
134
-
135
-
136
-
137
-
138
-
139
-
140
-
141
-
142
-
143
-
144
-
145
-
146
-
147
-
148
-
149
-
150
-
151
-
152
-
153
-
154
-
155
-
156
-
157
-
158
-
159
-
160
-
161
-
162
-
163
-
164
-
165
-
166
-
167
-
168
-
169
-
170
-
171
-
172
-
173
-
174
-
175
-
176
-
177
-
178
-
179
-
180
-
181
-
182
-
183
-
184
-
185
-
186
-
187
-
188
-
189
-
190
-
191
-
192
-
193
-
194
-
195
-
196
-
197
-
198
-
199
-
200
-
201
-
202
-
203
-
204
-
205
-
206
-
207
-
208
-
209
-
210
-
211
-
212
-
213
-
214
-
215
-
216
 |
 |

Wireless
Wireless revenue of $241.8 million in 2012 decreased by 13% compared to 2011, driven by a 13% decrease
in the Company’s subscriber base. The Company believes it continued to lose subscribers in 2012 due to
customer preference for its competitors’ premium handsets on competitors’ LTE networks. Our postpaid
smartphone subscriber base continues to be instrumental to increasing data revenue per subscriber (e.g., text
messaging, emails, and internet service) as this increase mitigates the decline in voice revenue, resulting in a
stable average revenue per subscriber.
Operating income of $51.2 million increased by $47.9 million compared to 2011 due primarily to the $50.3
million goodwill impairment loss that was recognized in 2011. Although the Wireless revenue decline of $35.8
million was substantial, the Company was able to mostly offset this decline with the favorable impact of lower
operating expenses. Management believes it will not be able to offset the declining Wireless revenues with cost
reductions in 2013 to the extent it was able to achieve in 2012.
IT Services and Hardware
IT Services and Hardware revenue in 2012 was $315.7 million, up 5% compared to 2011, driven by an
increase of $16.6 million, or 18%, in revenue from managed and professional services due to higher customer
demand for IT outsourcing and consulting projects. This increased revenue was partially offset by slightly lower
sales of telecom and IT equipment that is largely attributable to the cyclical nature of capital spending by
enterprise customers.
Operating income of $10.3 million in 2012 increased by $0.5 million over 2011 primarily due to lower
restructuring charges.
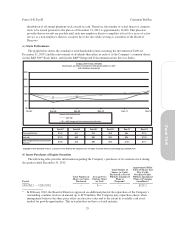
Data Center Colocation
Data Center Colocation revenue was $221.3 million in 2012, up 20% compared to 2011, on sales of
incremental space and power to both new and existing customers. Total data center capacity increased by 22%
from the prior year to 932,000 square feet as of December 31, 2012, compared to a total of 763,000 square feet of
capacity at December 31, 2011. CyrusOne’s utilization at the end of 2012 was 78% compared to 88% at the end
of 2011. This decrease in utilization resulted from the significant construction of new space in 2012 that is now
available for sale.
Operating income for the year totaled $30.4 million, a decrease of $16.0 million over 2011, due largely to a
$13.3 million impairment loss associated with the segment’s 2007 GramTel acquisition.
Consolidated Results of Operations
2012 Compared to 2011
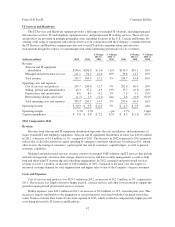
Service revenue was $1,272.8 million in 2012, an increase of $22.0 million compared to 2011. Data center
revenue increased by $36.6 million due to sales of new data center space and power, while managed and
professional services revenue increased by $16.6 million in 2012 as a result of increased IT outsourcing and
consulting projects. These increases were partially offset by lower wireless service revenue which declined by
$27.9 million in 2012 compared to 2011. Growth in Wireline Fioptics, VoIP and audio conferencing service
revenue was offset by declines in local voice, long distance and DSL revenues.
Product revenue totaled $201.1 million in 2012, a decrease of $10.5 million, or 5%, compared to 2011. This
decrease was largely due to lower sales of wireless handsets which drove a $7.9 million decrease in sales
compared to 2011. In addition, sales of telecommunications and IT hardware decreased by $1.4 million
compared to 2011, a reflection of the cyclical nature of capital spending by enterprise customers.
Cost of services was $489.9 million in 2012 compared to $464.3 million in 2011, an increase of $25.6
million, or 6%. Contract services increased by $10.7 million over 2011 driven largely by increased use of outside
contractors to support the growth in data center operations and Fioptics, business data and VoIP services, and
also due to positioning CyrusOne to operate as a stand-alone publicly-traded company. Operating taxes increased
32
Form 10-K Part II Cincinnati Bell Inc.