Cincinnati Bell 2012 Annual Report Download - page 112
Download and view the complete annual report
Please find page 112 of the 2012 Cincinnati Bell annual report below. You can navigate through the pages in the report by either clicking on the pages listed below, or by using the keyword search tool below to find specific information within the annual report.-
 1
1 -
2
-
3
-
4
-
5
-
6
-
7
-
8
-
9
-
10
-
11
-
12
-
13
-
14
-
15
-
16
-
17
-
18
-
19
-
20
-
21
-
22
-
23
-
24
-
25
-
26
-
27
-
28
-
29
-
30
-
31
-
32
-
33
-
34
-
35
-
36
-
37
-
38
-
39
-
40
-
41
-
42
-
43
-
44
-
45
-
46
-
47
-
48
-
49
-
50
-
51
-
52
-
53
-
54
-
55
-
56
-
57
-
58
-
59
-
60
-
61
-
62
-
63
-
64
-
65
-
66
-
67
-
68
-
69
-
70
-
71
-
72
-
73
-
74
-
75
-
76
-
77
-
78
-
79
-
80
-
81
-
82
-
83
-
84
-
85
-
86
-
87
-
88
-
89
-
90
-
91
-
92
-
93
-
94
-
95
-
96
-
97
-
98
-
99
-
100
-
101
-
 102
102 -
 103
103 -
 104
104 -
 105
105 -
 106
106 -
 107
107 -
 108
108 -
 109
109 -
 110
110 -
 111
111 -
 112
112 -
 113
113 -
 114
114 -
 115
115 -
 116
116 -
 117
117 -
 118
118 -
 119
119 -
 120
120 -
 121
121 -
 122
122 -
123
-
124
-
125
-
126
-
127
-
128
-
129
-
130
-
131
-
132
-
133
-
134
-
135
-
136
-
137
-
138
-
139
-
140
-
141
-
142
-
143
-
144
-
145
-
146
-
147
-
148
-
149
-
150
-
151
-
152
-
153
-
154
-
155
-
156
-
157
-
158
-
159
-
160
-
161
-
162
-
163
-
164
-
165
-
166
-
167
-
168
-
169
-
170
-
171
-
172
-
173
-
174
-
175
-
176
-
177
-
178
-
179
-
180
-
181
-
182
-
183
-
184
-
185
-
186
-
187
-
188
-
189
-
190
-
191
-
192
-
193
-
194
-
195
-
196
-
197
-
198
-
199
-
200
-
201
-
202
-
203
-
204
-
205
-
206
-
207
-
208
-
209
-
210
-
211
-
212
-
213
-
214
-
215
-
216
 |
 |
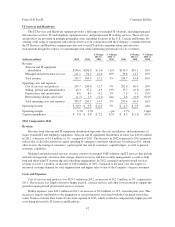
2011 Compared to 2010
Revenues
Voice local service revenue was $280.3 million in 2011, a decrease of 10% compared to the prior period.
The decrease in revenue was driven by access line loss from the prior year. Access lines decreased by 52,800, or
8% compared to 2010.
Data revenue was $291.5 million in 2011, up $8.2 million compared to the same period in 2010. Revenue
from Fioptics high-speed internet service increased to $15.8 million in 2011, up from $10.2 million in the prior
year. As of December 31, 2011, the Company had 39,300 high-speed internet Fioptics subscribers, which is an
increase of 12,100 subscribers, or 44%, from the December 31, 2010 total of 27,200 subscribers. These increases
were primarily offset by lower DSL revenue resulting from a 5% decline in subscribers from 2010.
Long distance and VoIP revenue was $111.3 million in 2011, an increase of $6.9 million, or 7%, compared
to 2010. The increase was primarily attributable to an increase in VoIP and audio conferencing services provided
to additional subscribers. This increase was partially offset by a $4.1 million decrease in long distance residential
revenue. As of December 31, 2011, long distance subscriber lines were 447,400, a 7% decline from 2010.
Entertainment revenue was $26.6 million in 2011, up $9.9 million, or 59%, compared to 2010. Fioptics
entertainment subscribers totaled 39,600 at December 31, 2011, an increase of 41% compared to December 31,
2010. The increase in entertainment subscribers is related to expansions of the Fioptics network and high
customer demand.
Other revenue was $22.4 million for 2011, down $3.8 million from 2010. The sale of the Company’s home
security monitoring business decreased revenues by $2.1 million in 2011. Fewer wire installation jobs also
contributed to lower revenues compared to the prior year.
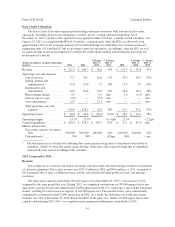
Costs and Expenses
Cost of services and products was $270.0 million, an increase of $13.2 million, or 5%, compared to 2010.
Payroll related costs and contract services were up $6.6 million and $2.7 million, respectively, primarily due to
overtime associated with the start-up of Fioptics IPTV, as well as higher volumes of repair work resulting from
record rainfall in our operating territory. Network costs also increased by $6.0 million in 2011 compared to 2010
as a result of growth in audio conferencing, VoIP, and Fioptics services.
SG&A expenses were $126.7 million, a decrease of $13.4 million, or 10%, compared to 2010. Payroll and
other employee related costs were down $10.1 million due to lower headcount. Contract services and advertising
costs were down $2.8 million and $1.5 million, respectively, compared to 2010. Partially offsetting these
favorable variances were higher legal and consulting costs and non-employee commissions in 2011.
Depreciation and amortization was $102.4 million in 2011, down $1.5 million compared to 2010.
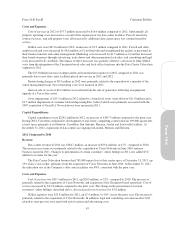
Restructuring charges in 2011 were $7.7 million, a decrease of $0.5 million compared to 2010. Employee
separation costs were $3.5 million in 2011 and $4.9 million in 2010. Lease abandonment costs were $2.5 million
and $3.3 million in 2011 and 2010, respectively. Contract termination costs were $1.7 million in 2011, with no
such costs incurred in the prior year.
In 2011, curtailment losses of $4.2 million were recognized from the reduction of future pension benefits for
certain bargained employees. The sale of substantially all the assets associated with our home security business
in 2011 resulted in a gain of $8.4 million. Asset impairment losses were $1.0 million 2011, with no such losses in
2010. Asset impairment losses arose from abandoned leasehold improvements related to vacated office space and
the write-down to fair value of certain assets held for sale.
Capital Expenditures
Capital expenditures were $112.6 million in 2011, an increase of $14.0 million, or 14%, compared to 2010.
Spending to expand the Company’s Fioptics service area increased by $22.1 million from 2010 to 2011.
38
Form 10-K Part II Cincinnati Bell Inc.