Cincinnati Bell 2012 Annual Report Download - page 121
Download and view the complete annual report
Please find page 121 of the 2012 Cincinnati Bell annual report below. You can navigate through the pages in the report by either clicking on the pages listed below, or by using the keyword search tool below to find specific information within the annual report.-
 1
1 -
2
-
3
-
4
-
5
-
6
-
7
-
8
-
9
-
10
-
11
-
12
-
13
-
14
-
15
-
16
-
17
-
18
-
19
-
20
-
21
-
22
-
23
-
24
-
25
-
26
-
27
-
28
-
29
-
30
-
31
-
32
-
33
-
34
-
35
-
36
-
37
-
38
-
39
-
40
-
41
-
42
-
43
-
44
-
45
-
46
-
47
-
48
-
49
-
50
-
51
-
52
-
53
-
54
-
55
-
56
-
57
-
58
-
59
-
60
-
61
-
62
-
63
-
64
-
65
-
66
-
67
-
68
-
69
-
70
-
71
-
72
-
73
-
74
-
75
-
76
-
77
-
78
-
79
-
80
-
81
-
82
-
83
-
84
-
85
-
86
-
87
-
88
-
89
-
90
-
91
-
92
-
93
-
94
-
95
-
96
-
97
-
98
-
99
-
100
-
101
-
102
-
103
-
104
-
105
-
106
-
107
-
108
-
109
-
110
-
 111
111 -
 112
112 -
 113
113 -
 114
114 -
 115
115 -
 116
116 -
 117
117 -
 118
118 -
 119
119 -
 120
120 -
 121
121 -
 122
122 -
 123
123 -
 124
124 -
 125
125 -
 126
126 -
 127
127 -
 128
128 -
 129
129 -
 130
130 -
 131
131 -
132
-
133
-
134
-
135
-
136
-
137
-
138
-
139
-
140
-
141
-
142
-
143
-
144
-
145
-
146
-
147
-
148
-
149
-
150
-
151
-
152
-
153
-
154
-
155
-
156
-
157
-
158
-
159
-
160
-
161
-
162
-
163
-
164
-
165
-
166
-
167
-
168
-
169
-
170
-
171
-
172
-
173
-
174
-
175
-
176
-
177
-
178
-
179
-
180
-
181
-
182
-
183
-
184
-
185
-
186
-
187
-
188
-
189
-
190
-
191
-
192
-
193
-
194
-
195
-
196
-
197
-
198
-
199
-
200
-
201
-
202
-
203
-
204
-
205
-
206
-
207
-
208
-
209
-
210
-
211
-
212
-
213
-
214
-
215
-
216
 |
 |

Form 10-K Part II Cincinnati Bell Inc.
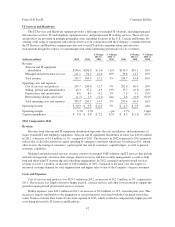
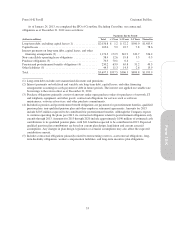
impact of CyrusOne as of December 31, 2012, we had $239.7 million of short-term liquidity, comprised of $7.4
million of cash and cash equivalents and the total unused capacity of $232.3 million from our Corporate Credit
Agreement and Receivables Facility.
Our primary uses of cash are capital expenditures and debt service. In 2012, 2011 and 2010, capital
expenditures were $367.2 million, $255.5 million, and $149.7 million, respectively. The higher capital
expenditures in 2012 resulted from increased spending on CyrusOne data centers, which totaled $228.2 million in
2012. In 2013, capital expenditures are expected to be in a range of $180 million to $190 million. In 2012, 2011
and 2010, debt repayments were $442.4 million, $11.5 million, and $1,554.5 million, respectively. In the fourth
quarter of 2012, CyrusOne LP and CyrusOne Finance Corp issued $525 million of 6 3/8% Senior Notes, the
proceeds from which were used to repay its intercompany payables, to pay debt issuance costs, and also to
support its operations. In turn, the Company used the $480 million of proceeds received from CyrusOne to make
debt repayments, to pay the debt redemption premiums and accrued interest obligations associated with such
repayments, and to also pay the debt issuance costs related to its new Corporate Credit Agreement.
Interest payments were $217.9 million, $211.8 million and $172.4 million in 2012, 2011 and 2010,
respectively. The higher interest payments in 2012 were largely the result of $4.6 million of accelerated interest
payments associated with the early redemption in the fourth quarter of 2012 of the 7% Senior Notes due 2015.
Interest on these bonds was previously due semi-annually in February and August of each year. Also contributing
to the increased interest payments was the impact of higher capital lease and other financial obligations primarily
associated with CyrusOne’s increased data center footprint. For 2013, excluding the impact of CyrusOne, our
contractual debt maturities, including capital lease obligations, are $7.1 million and associated contractual
interest payments are expected to be approximately $175 million.
To a lesser extent, cash is also used primarily to fund our pension obligations, to pay preferred stock
dividends, and also to repurchase shares of common stock as and when the stock price offers an attractive
valuation. Cash contributions to our qualified pension plans were $23.9 million, $18.1 million and $5.6 million in
2012, 2011 and 2010, respectively. Contributions to our qualified pension plans for 2013 are expected to be
$41.6 million. Dividends paid on preferred stock were $10.4 million in each of 2012, 2011 and 2010. We do not
currently pay dividends on our common shares, nor do we plan to pay dividends on such shares in 2013. In 2012,
2011 and 2010, cash used to repurchase common shares was $0.3 million, $10.4 million and $10.0 million,
respectively. As of December 31, 2012, management has authority to repurchase additional common shares with
a value of up to $129.2 million under the most recent plan approved by the Board of Directors. This plan does not
have a stated maturity date. Management may purchase additional shares in the future to the extent that cash is
available and management believes the share price offers an attractive value.
The Company’s Receivables Facility, which had $32.3 million in available borrowing capacity at
December 31, 2012, is subject to renewal annually. While we expect to continue to renew this facility, we would
be required to use cash, our Corporate Credit Agreement, or other sources to repay any outstanding balance on
the Receivables Facility if it were not renewed.
Management believes that cash on hand, cash generated from operations, and available funding from its
credit facilities will be adequate to meet the Company’s investing and financing needs for 2013.
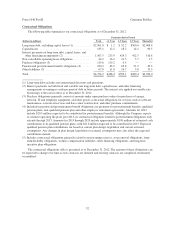
Long-term view, including debt covenants
As of December 31, 2012, the Company had $2.7 billion of outstanding indebtedness and an accumulated
deficit of $3.2 billion. Excluding the impact of CyrusOne’s debt, the Company’s indebtedness at December 31,
2012 amounted to $2.1 billion. A significant amount of indebtedness was previously incurred from the purchase
and operation of a national broadband business, which was sold in 2003.
In addition to the uses of cash described in the Short-term view section above, the Company has to satisfy
the above-mentioned long-term debt obligations. The Company has no significant debt maturities until 2017.
Contractual debt maturities, excluding CyrusOne, are $7.1 million in 2013, $57.8 million in 2014, $5.1 million in
2015, $5.2 million in 2016, $502.6 million in 2017 and $1,562.0 million thereafter. In addition, we have ongoing
47
Form 10-K