Cincinnati Bell 2012 Annual Report Download - page 185
Download and view the complete annual report
Please find page 185 of the 2012 Cincinnati Bell annual report below. You can navigate through the pages in the report by either clicking on the pages listed below, or by using the keyword search tool below to find specific information within the annual report.-
 1
1 -
2
-
3
-
4
-
5
-
6
-
7
-
8
-
9
-
10
-
11
-
12
-
13
-
14
-
15
-
16
-
17
-
18
-
19
-
20
-
21
-
22
-
23
-
24
-
25
-
26
-
27
-
28
-
29
-
30
-
31
-
32
-
33
-
34
-
35
-
36
-
37
-
38
-
39
-
40
-
41
-
42
-
43
-
44
-
45
-
46
-
47
-
48
-
49
-
50
-
51
-
52
-
53
-
54
-
55
-
56
-
57
-
58
-
59
-
60
-
61
-
62
-
63
-
64
-
65
-
66
-
67
-
68
-
69
-
70
-
71
-
72
-
73
-
74
-
75
-
76
-
77
-
78
-
79
-
80
-
81
-
82
-
83
-
84
-
85
-
86
-
87
-
88
-
89
-
90
-
91
-
92
-
93
-
94
-
95
-
96
-
97
-
98
-
99
-
100
-
101
-
102
-
103
-
104
-
105
-
106
-
107
-
108
-
109
-
110
-
111
-
112
-
113
-
114
-
115
-
116
-
117
-
118
-
119
-
120
-
121
-
122
-
123
-
124
-
125
-
126
-
127
-
128
-
129
-
130
-
131
-
132
-
133
-
134
-
135
-
136
-
137
-
138
-
139
-
140
-
141
-
142
-
143
-
144
-
145
-
146
-
147
-
148
-
149
-
150
-
151
-
152
-
153
-
154
-
155
-
156
-
157
-
158
-
159
-
160
-
161
-
162
-
163
-
164
-
165
-
166
-
167
-
168
-
169
-
170
-
171
-
172
-
173
-
174
-
 175
175 -
 176
176 -
 177
177 -
 178
178 -
 179
179 -
 180
180 -
 181
181 -
 182
182 -
 183
183 -
 184
184 -
 185
185 -
 186
186 -
 187
187 -
 188
188 -
 189
189 -
 190
190 -
 191
191 -
 192
192 -
 193
193 -
 194
194 -
 195
195 -
196
-
197
-
198
-
199
-
200
-
201
-
202
-
203
-
204
-
205
-
206
-
207
-
208
-
209
-
210
-
211
-
212
-
213
-
214
-
215
-
216
 |
 |

Form 10-K Part II Cincinnati Bell Inc.
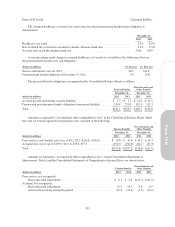
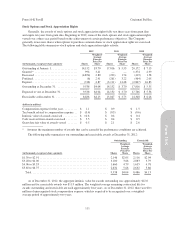
Stock Options and Stock Appreciation Rights
Generally, the awards of stock options and stock appreciation rights fully vest three years from grant date
and expire ten years from grant date. Beginning in 2012, some of the stock options and stock appreciation rights
vested over a three year period based on the achievement of certain performance objectives. The Company
generally issues new shares when options to purchase common shares or stock appreciation rights are exercised.
The following table summarizes stock options and stock appreciation rights activity:
2012 2011 2010
Weighted-
Average
Exercise
Price Per
Share Shares
Weighted-
Average
Exercise
Price Per
Share
Weighted-
Average
Exercise
Price Per
Share(in thousands, except per share amounts) Shares Shares
Outstanding at January 1, ................. 14,152 $3.70 17,816 $ 5.55 20,172 $ 7.15
Granted * .............................. 994 3.41 — — 1,374 2.99
Exercised .............................. (4,854) 2.80 (292) 1.74 (419) 1.58
Forfeited ............................... (6) 2.91 (261) 3.22 (464) 2.05
Expired ................................ (748) 4.87 (3,111) 14.48 (2,847) 16.83
Outstanding at December 31, .............. 9,538 $4.04 14,152 $ 3.70 17,816 $ 5.55
Expected to vest at December 31, ........... 9,538 $4.04 14,152 $ 3.70 17,766 $ 5.56
Exercisable at December 31, ............... 8,486 $4.13 13,047 $ 3.73 14,348 $ 6.26
(dollars in millions)
Compensation expense for the year .......... $ 1.1 $ 0.9 $ 1.5
Tax benefit related to compensation expense . . $ (0.4) $ (0.3) $ (0.6)
Intrinsic value of awards exercised .......... $ 10.6 $ 0.4 $ 0.4
Cash received from awards exercised ........ $ 5.5 $ 0.4 $ 0.5
Grant date fair value of awards vested ....... $ 0.5 $ 2.1 $ 2.6
* Assumes the maximum number of awards that can be earned if the performance conditions are achieved.
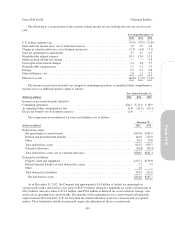
The following table summarizes our outstanding and exercisable awards at December 31, 2012:
Outstanding Exercisable
Weighted-
Average
Exercise
Price Per
Share
Weighted-
Average
Exercise
Price Per
Share(in thousands, except per share amounts) Shares Shares
$1.39 to $2.91 ................................................ 2,146 $2.05 2,116 $2.04
$3.28 to $4.00 ................................................ 3,100 3.66 2,083 3.79
$4.06 to $5.53 ................................................ 1,660 4.79 1,655 4.78
$5.65 to $6.75 ................................................ 2,632 5.66 2,632 5.66
Total ..................................................... 9,538 $4.04 8,486 $4.13
As of December 31, 2012, the aggregate intrinsic value for awards outstanding was approximately $12.0
million and for exercisable awards was $11.9 million. The weighted-average remaining contractual life for
awards outstanding and exercisable are each approximately four years. As of December 31, 2012, there was $0.1
million of unrecognized stock compensation expense, which is expected to be recognized over a weighted-
average period of approximately two years.
111
Form 10-K