Cincinnati Bell 2012 Annual Report Download - page 56
Download and view the complete annual report
Please find page 56 of the 2012 Cincinnati Bell annual report below. You can navigate through the pages in the report by either clicking on the pages listed below, or by using the keyword search tool below to find specific information within the annual report.-
 1
1 -
2
-
3
-
4
-
5
-
6
-
7
-
8
-
9
-
10
-
11
-
12
-
13
-
14
-
15
-
16
-
17
-
18
-
19
-
20
-
21
-
22
-
23
-
24
-
25
-
26
-
27
-
28
-
29
-
30
-
31
-
32
-
33
-
34
-
35
-
36
-
37
-
38
-
39
-
40
-
41
-
42
-
43
-
44
-
45
-
 46
46 -
 47
47 -
 48
48 -
 49
49 -
 50
50 -
 51
51 -
 52
52 -
 53
53 -
 54
54 -
 55
55 -
 56
56 -
 57
57 -
 58
58 -
 59
59 -
 60
60 -
 61
61 -
 62
62 -
 63
63 -
 64
64 -
 65
65 -
 66
66 -
67
-
68
-
69
-
70
-
71
-
72
-
73
-
74
-
75
-
76
-
77
-
78
-
79
-
80
-
81
-
82
-
83
-
84
-
85
-
86
-
87
-
88
-
89
-
90
-
91
-
92
-
93
-
94
-
95
-
96
-
97
-
98
-
99
-
100
-
101
-
102
-
103
-
104
-
105
-
106
-
107
-
108
-
109
-
110
-
111
-
112
-
113
-
114
-
115
-
116
-
117
-
118
-
119
-
120
-
121
-
122
-
123
-
124
-
125
-
126
-
127
-
128
-
129
-
130
-
131
-
132
-
133
-
134
-
135
-
136
-
137
-
138
-
139
-
140
-
141
-
142
-
143
-
144
-
145
-
146
-
147
-
148
-
149
-
150
-
151
-
152
-
153
-
154
-
155
-
156
-
157
-
158
-
159
-
160
-
161
-
162
-
163
-
164
-
165
-
166
-
167
-
168
-
169
-
170
-
171
-
172
-
173
-
174
-
175
-
176
-
177
-
178
-
179
-
180
-
181
-
182
-
183
-
184
-
185
-
186
-
187
-
188
-
189
-
190
-
191
-
192
-
193
-
194
-
195
-
196
-
197
-
198
-
199
-
200
-
201
-
202
-
203
-
204
-
205
-
206
-
207
-
208
-
209
-
210
-
211
-
212
-
213
-
214
-
215
-
216
 |
 |

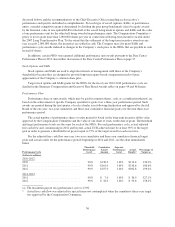
EXECUTIVE COMPENSATION
Summary Compensation Table
The following table sets forth information concerning the compensation of any person who served as the
principal executive officer (John F. Cassidy) or principal financial officer (Kurt A. Freyberger) during the year
ended December 31, 2012, and the three most highly compensated persons who served as executive officers
(Theodore H. Torbeck, Gary J. Wojtaszek, Christopher J. Wilson) during the year ended December 31, 2012
(collectively, the “NEOs”):
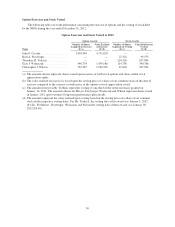
Summary Compensation Table — Fiscal 2012
Name, Principal Position Year
Salary
($)
Bonus
($) (a)
Stock
Awards
($) (b) (c)
Option
Awards
($) (d)
Non-Equity
Incentive
Plan
Compensation
($) (e)
Change in
Pension Value
and
Non-Qualified
Deferred
Compensation
Earnings
($) (f)
All Other
Compensation
($) (g)
Total
($)
John F. Cassidy ............ 2012 708,769 — 1,015,000 1,015,000 2,877,200 1,121,703 9,000 6,746,672
President and Chief
Executive Officer
2011 681,250 — — 1,015,000 2,507,759 1,851,404 8,800 6,064,213
2010 645,000 2,100,000 — 720,136 2,963,467 2,090,059 43,800 8,562,462
Kurt A. Freyberger (h) ....... 2012 347,885 250,000 250,000 441,238 40,111 9,800 1,339,034
Vice President and Chief
Financial Officer
2011 293,460 — 77,500 — 324,190 33,800 9,800 738,750
Theodore H. Torbeck (i) ..... 2012 726,000 — 1,800,000 — 970,045 — 9,800 3,505,845
President and General 2011 724,850 1,800,000 — 1,025,838 — 863 3,551,551
Manager, Cincinnati Bell
Communications Group
2010 161,538 — 792,000 — 966,000 — 5,741 1,925,279
Gary J. Wojtaszek .......... 2012 576,000 — 250,000 250,000 649,094 11,864 6,366 1,743,324
President of CyrusOne 2011 557,884 — 302,499 — 698,688 10,301 9,800 1,579,172
2010 383,788 — 302,500 582,296 770,000 4,675 31,168 2,074,427
Christopher J. Wilson ....... 2012 345,662 — 200,000 200,000 284,111 103,242 9,800 1,142,815
Vice President, General
Counsel and Secretary
2011 339,685 — 200,002 — 301,223 89,877 8,298 939,085
2010 312,931 — 295,001 463,401 282,762 42,680 25,019 1,421,794
(a) The amount represents the retention bonus paid to Mr. Cassidy in 2010.
(b) The 2012 amounts, excluding Mr. Torbeck’s amount, reflect the grant-date fair value of the performance share-based awards issued in
2012 to Messrs. Cassidy, Freyberger, Wojtaszek and Wilson for the 2012-2014 performance cycle. The 2011 amounts, excluding
Mr. Torbeck’s amount, reflect the grant-date fair value of the performance share-based awards issued in 2011 to Messrs. Freyberger,
Wojtaszek and Wilson for the 2011-2013 performance cycle. The 2010 amounts, excluding Mr. Torbeck’s amount, reflect the grant-date
fair value of the performance share-based awards issued in 2010 to Messrs. Wojtaszek and Wilson for the 2010-2012 performance cycle.
All amounts assume payout at target. For further discussion of these awards, see Note 14 to our Consolidated Financial Statements
included in our Annual Report on Form 10-K for the year ended December 31, 2012. The table below shows the amounts if the
maximum payout is earned based on the stock price at date of grant.
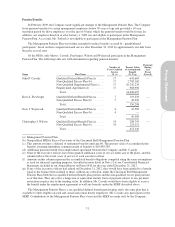
Stock Awards ($)
Name 2012 2011 2010
John F. Cassidy ........................................................... 1,522,500 — —
Kurt A. Freyberger ........................................................ 375,000 116,250 —
Gary J. Wojtaszek ......................................................... 375,000 453,749 453,750
Christopher J. Wilson ...................................................... 300,000 300,002 442,501
(c) The 2012 and 2011 amounts for Mr. Torbeck represents a restricted common share grant that vests one-third per year at the end of each
one-year period. The 2010 amount for Mr. Torbeck represents a grant of 300,000 unrestricted common shares when he joined the
Company in September 2010. These grants were all made in accordance with Mr. Torbeck’s employment agreement.
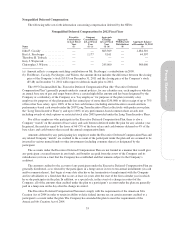
(d) The 2012 amounts shown reflect the aggregate grant date fair value of performance-based options granted to Mr. Cassidy and
performance-based stock appreciation rights granted to Messrs. Freyberger, Wojtaszek and Wilson in 2012 for the 2012 – 2014
performance cycle. The 2011 amount reflects the grant date fair value of cash-settled stock appreciation rights granted to Mr. Cassidy in
January 2011. The 2010 amounts reflect the aggregate grant-date fair value of stock options and stock appreciation rights granted in
January 2010 to Messrs. Cassidy, Wojtaszek and Wilson. For all awards, the grant date fair value was computed in accordance with
Accounting Standards Codification (“ASC”) 718. For further discussion of the assumptions utilized to value these awards, see Note 14 to
our Consolidated Financial Statements included in our Annual Report on Form 10-K for the year ended December 31, 2012. All 2012
awards are performance-based awards. The amounts shown above reflect payout at target.
44