Cincinnati Bell 2012 Annual Report Download - page 177
Download and view the complete annual report
Please find page 177 of the 2012 Cincinnati Bell annual report below. You can navigate through the pages in the report by either clicking on the pages listed below, or by using the keyword search tool below to find specific information within the annual report.-
 1
1 -
2
-
3
-
4
-
5
-
6
-
7
-
8
-
9
-
10
-
11
-
12
-
13
-
14
-
15
-
16
-
17
-
18
-
19
-
20
-
21
-
22
-
23
-
24
-
25
-
26
-
27
-
28
-
29
-
30
-
31
-
32
-
33
-
34
-
35
-
36
-
37
-
38
-
39
-
40
-
41
-
42
-
43
-
44
-
45
-
46
-
47
-
48
-
49
-
50
-
51
-
52
-
53
-
54
-
55
-
56
-
57
-
58
-
59
-
60
-
61
-
62
-
63
-
64
-
65
-
66
-
67
-
68
-
69
-
70
-
71
-
72
-
73
-
74
-
75
-
76
-
77
-
78
-
79
-
80
-
81
-
82
-
83
-
84
-
85
-
86
-
87
-
88
-
89
-
90
-
91
-
92
-
93
-
94
-
95
-
96
-
97
-
98
-
99
-
100
-
101
-
102
-
103
-
104
-
105
-
106
-
107
-
108
-
109
-
110
-
111
-
112
-
113
-
114
-
115
-
116
-
117
-
118
-
119
-
120
-
121
-
122
-
123
-
124
-
125
-
126
-
127
-
128
-
129
-
130
-
131
-
132
-
133
-
134
-
135
-
136
-
137
-
138
-
139
-
140
-
141
-
142
-
143
-
144
-
145
-
146
-
147
-
148
-
149
-
150
-
151
-
152
-
153
-
154
-
155
-
156
-
157
-
158
-
159
-
160
-
161
-
162
-
163
-
164
-
165
-
166
-
 167
167 -
 168
168 -
 169
169 -
 170
170 -
 171
171 -
 172
172 -
 173
173 -
 174
174 -
 175
175 -
 176
176 -
 177
177 -
 178
178 -
 179
179 -
 180
180 -
 181
181 -
 182
182 -
 183
183 -
 184
184 -
 185
185 -
 186
186 -
 187
187 -
188
-
189
-
190
-
191
-
192
-
193
-
194
-
195
-
196
-
197
-
198
-
199
-
200
-
201
-
202
-
203
-
204
-
205
-
206
-
207
-
208
-
209
-
210
-
211
-
212
-
213
-
214
-
215
-
216
 |
 |

Form 10-K Part II Cincinnati Bell Inc.
At December 31, 2012 and 2011, $5.8 million and $12.6 million, respectively, of the restructuring liabilities
were included in “Other current liabilities,” and $7.7 million and $11.4 million, respectively, were included in
“Other noncurrent liabilities,” in the Consolidated Balance Sheets.
11. Pension and Postretirement Plans
Savings Plans
The Company sponsors several defined contribution plans covering substantially all employees. The
Company’s contributions to the plans are based on matching a portion of the employee contributions. Both
employer and employee contributions are invested in various investment funds at the direction of the employee.
Employer contributions to the defined contribution plans were $6.9 million, $6.4 million, and $4.8 million in
2012, 2011, and 2010, respectively.
Pension and Postretirement Plans
The Company sponsors three noncontributory defined benefit pension plans: one for eligible management
employees, one for non-management employees, and one supplemental, nonqualified, unfunded plan for certain
former senior executives. The management pension plan is a cash balance plan in which the pension benefit is
determined by a combination of compensation-based credits and annual guaranteed interest credits. The non-
management pension plan is also a cash balance plan in which the combination of service and job-classification-
based credits and annual interest credits determine the pension benefit. Benefits for the supplemental plan are
based on eligible pay, adjusted for age and service upon retirement. We fund both the management and non-
management plans in an irrevocable trust through contributions, which are determined using the traditional unit
credit cost method. We also use the traditional unit credit cost method for determining pension cost for financial
reporting purposes. Effective January 1, 2012, future pension service credits were eliminated for certain non-
management employees which resulted in a remeasurement of the projected benefit obligations for this plan. In
2011, a curtailment loss of $4.2 million was recognized upon remeasurement.
The Company also provides healthcare and group life insurance benefits for eligible retirees. We fund
healthcare benefits and other group life insurance benefits using Voluntary Employee Benefit Association
(“VEBA”) trusts. It is our practice to fund amounts as deemed appropriate from time to time. Contributions are
subject to Internal Revenue Service (“IRS”) limitations developed using the traditional unit credit cost method.
The actuarial expense calculation for our postretirement health plan is based on numerous assumptions,
estimates, and judgments including healthcare cost trend rates and cost sharing with retirees. Retiree healthcare
benefits are being phased out for both management and certain retirees.
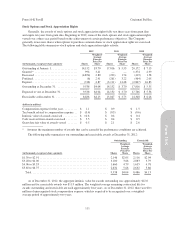
Components of Net Periodic Cost
The following information relates to noncontributory defined benefit pension plans, postretirement
healthcare plans, and life insurance benefit plans. Approximately 11% in 2012, 7% in 2011, and 8% in 2010 of
these costs were capitalized to property, plant and equipment related to network construction in the Wireline
segment. Pension and postretirement benefit costs for these plans were comprised of:
Pension Benefits
Postretirement and Other
Benefits
(dollars in millions) 2012 2011 2010 2012 2011 2010
Service cost ...................................... $ 2.6 $ 5.1 $ 5.2 $ 0.5 $ 0.3 $ 0.2
Interest cost on projected benefit obligation ............. 21.3 24.8 26.8 5.6 7.1 8.0
Expected return on plan assets ....................... (26.1) (29.3) (30.3) — — —
Amortization of:
Prior service cost (benefit) ........................ 0.1 0.3 0.5 (13.2) (13.2) (13.1)
Actuarial loss ................................... 19.4 14.3 9.3 6.8 6.5 5.2
Curtailment loss .................................. — 4.2————
Pension/postretirement costs ......................... $17.3 $ 19.4 $ 11.5 $ (0.3) $ 0.7 $ 0.3
103
Form 10-K