Cincinnati Bell 2012 Annual Report Download - page 113
Download and view the complete annual report
Please find page 113 of the 2012 Cincinnati Bell annual report below. You can navigate through the pages in the report by either clicking on the pages listed below, or by using the keyword search tool below to find specific information within the annual report.
Form 10-K Part II Cincinnati Bell Inc.
Wireless
The Wireless segment provides advanced digital voice and data communications services through the
operation of a regional wireless network in the Company’s licensed service territory, which surrounds Cincinnati
and Dayton, Ohio and includes areas of northern Kentucky and southeastern Indiana. Although Wireless does not
market to customers outside of its licensed service territory, it is able to provide service outside of this territory
through roaming agreements with other wireless operators. The segment also sells wireless handset devices and
related accessories to support its service business.
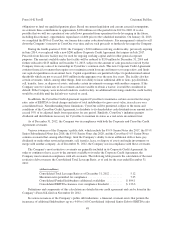
(dollars in millions, except for operating metrics) 2012 2011
$ Change
2012 vs.
2011
% Change
2012 vs.
2011 2010
$ Change
2011 vs.
2010
% Change
2011 vs.
2010
Revenue:
Postpaid service .................. $174.6 $199.2 $(24.6) (12)% $214.6 $(15.4) (7)%
Prepaid service ................... 49.9 53.2 (3.3) (6)% 54.6 (1.4) (3)%
Equipment and other .............. 17.3 25.2 (7.9) (31)% 20.0 5.2 26%
Total revenue .................... 241.8 277.6 (35.8) (13)% 289.2 (11.6) (4)%
Operating costs and expenses:
Cost of services and products ....... 113.0 134.2 (21.2) (16)% 137.4 (3.2) (2)%
Selling, general and administrative . . . 43.7 55.2 (11.5) (21)% 61.1 (5.9) (10)%
Depreciation and amortization ...... 31.9 33.5 (1.6) (5)% 33.4 0.1 0%
Restructuring charges ............. 1.6 — 1.6 n/m 1.0 (1.0) n/m
Impairment of goodwill ............ — 50.3 (50.3) n/m — 50.3 n/m
Impairment of assets, excluding
goodwill ...................... 0.4 1.1 (0.7) (64)% — 1.1 n/m
Total operating costs and expenses ..... 190.6 274.3 (83.7) (31)% 232.9 41.4 18%
Operating income .................. $ 51.2 $ 3.3 $ 47.9 n/m $ 56.3 $(53.0) (94)%
Operating margin ................... 21.2% 1.2% 20.0pts 19.5% (18.3)pts
Capital expenditures ................ $ 15.8 $ 17.6 $ (1.8) (10)% $ 11.7 $ 5.9 50%
Metrics information:
Postpaid ARPU* ................. $51.29 $50.06 $ 1.23 2% $49.79 $ 0.27 1%
Prepaid ARPU* .................. $28.48 $28.58 $(0.10) 0% $29.58 $(1.00) (3)%
Postpaid subscribers (in thousands) . . 251.3 311.0 (59.7) (19)% 351.2 (40.2) (11)%
Prepaid subscribers (in thousands) . . . 146.5 148.0 (1.5) (1)% 157.8 (9.8) (6)%
Average postpaid churn ............ 2.5% 2.2% 0.3pts 2.1% 0.1pts
* The Company has presented certain information regarding monthly average revenue per user (“ARPU”)
because the Company believes ARPU provides a useful measure of the operational performance of the
wireless business. ARPU is calculated by dividing service revenue by the average subscriber base for the
period.
2012 Compared to 2011
Revenue
Postpaid service revenue was $174.6 million in 2012, a decrease of $24.6 million, or 12%, compared to a
year ago. The decrease in postpaid service revenue was driven by a 19% decrease in postpaid subscribers
combined with a decrease in voice minutes of use, partially offset by higher data usage. The subscriber losses are
attributed to competitive pressure resulting from, among other factors, competitors’ premium handsets and
competitors’ service on new LTE networks.
39
Form 10-K


