Cincinnati Bell 2012 Annual Report Download - page 5
Download and view the complete annual report
Please find page 5 of the 2012 Cincinnati Bell annual report below. You can navigate through the pages in the report by either clicking on the pages listed below, or by using the keyword search tool below to find specific information within the annual report.-
 1
1 -
 2
2 -
 3
3 -
 4
4 -
 5
5 -
 6
6 -
 7
7 -
 8
8 -
 9
9 -
 10
10 -
 11
11 -
 12
12 -
 13
13 -
 14
14 -
 15
15 -
 16
16 -
17
-
18
-
19
-
20
-
21
-
22
-
23
-
24
-
25
-
26
-
27
-
28
-
29
-
30
-
31
-
32
-
33
-
34
-
35
-
36
-
37
-
38
-
39
-
40
-
41
-
42
-
43
-
44
-
45
-
46
-
47
-
48
-
49
-
50
-
51
-
52
-
53
-
54
-
55
-
56
-
57
-
58
-
59
-
60
-
61
-
62
-
63
-
64
-
65
-
66
-
67
-
68
-
69
-
70
-
71
-
72
-
73
-
74
-
75
-
76
-
77
-
78
-
79
-
80
-
81
-
82
-
83
-
84
-
85
-
86
-
87
-
88
-
89
-
90
-
91
-
92
-
93
-
94
-
95
-
96
-
97
-
98
-
99
-
100
-
101
-
102
-
103
-
104
-
105
-
106
-
107
-
108
-
109
-
110
-
111
-
112
-
113
-
114
-
115
-
116
-
117
-
118
-
119
-
120
-
121
-
122
-
123
-
124
-
125
-
126
-
127
-
128
-
129
-
130
-
131
-
132
-
133
-
134
-
135
-
136
-
137
-
138
-
139
-
140
-
141
-
142
-
143
-
144
-
145
-
146
-
147
-
148
-
149
-
150
-
151
-
152
-
153
-
154
-
155
-
156
-
157
-
158
-
159
-
160
-
161
-
162
-
163
-
164
-
165
-
166
-
167
-
168
-
169
-
170
-
171
-
172
-
173
-
174
-
175
-
176
-
177
-
178
-
179
-
180
-
181
-
182
-
183
-
184
-
185
-
186
-
187
-
188
-
189
-
190
-
191
-
192
-
193
-
194
-
195
-
196
-
197
-
198
-
199
-
200
-
201
-
202
-
203
-
204
-
205
-
206
-
207
-
208
-
209
-
210
-
211
-
212
-
213
-
214
-
215
-
216
 |
 |

In our wholesale Carrier market, our metro-fiber
investments will remain focused on wireless backhaul
projects and last-mile access for metro-Ethernet. The
Company currently generates combined revenue of
approximately $80 million annually associated with
these services.
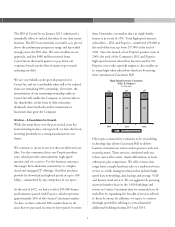
Our Fioptics and strategic business data and VoIP
product lines continued their growth trends in 2012,
offsetting the impact of access line losses. Wireline
revenue in 2012 was $731 million compared to $732
million generated in 2011. Operating income was $213
million, down $16 million or 7% compared to 2011,
and Adjusted EBITDA was $344 million, down 3%
from 2011, due in part to the costs of acquiring new
Fioptics customers. Access line loss continued to be
controlled at 7.6% in 2012, a slight improvement from
the 7.8% loss we experienced in 2011. In 2012, we
showed clear signs of reversing the declines in Wireline
revenue and Adjusted EBITDA as a result of the
investments made in fiber products over the past several
years.
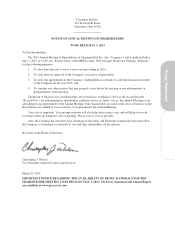
Fioptics Subscribers
(in thousands)
17
29
28
40
27
39
Voice Entertainment Internet
2010 2011 2012
41
55 57
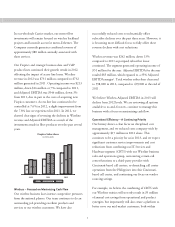
Wireless – Focused on Maximizing Cash Flow
Our wireless business faces intense competitive pressures
from the national players. Our team continues to do an
outstanding job providing excellent products and
services to our wireless customers. We have also
successfully reduced costs to substantially offset
subscriber declines over the past three years. However, it
is becoming more difficult for us to fully offset these
revenue declines with cost reductions.
Wireless revenue was $242 million, down 13%
compared to 2011 as postpaid subscriber losses
continued. The segment generated operating income of
$51 million for the year. Adjusted EBITDA for the year
totaled $85 million, which equated to a 35% Adjusted
EBITDA margin2. Total wireless subscribers decreased
to 398,000 in 2012, compared to 459,000 at the end of
2011.
We believe Wireless Adjusted EBITDA in 2013 will
decline from 2012 levels. We are reviewing all options
available to us and, for now, continue to manage this
business with a focus on maximizing cash flow.
Operational Efficiency – A Continuing Priority
Our history shows a clear focus on disciplined cost
management, and we reduced costs company-wide by
approximately $15 million in 2012 alone. This
continues to be a priority for us in 2013, and we expect
significant customer service improvements and cost
reductions from combining our IT Services and
Hardware segment (CBTS) with our Wireline business
sales and operations group, outsourcing certain call
center functions to a third-party provider with
Cincinnati-based call centers, re-domiciling call center
operations from the Philippines into this Cincinnati-
based call center, and continuing our focus on vendor
sourcing savings.
For example, we believe the combining of CBTS with
our Wireline entities will not only result in $5 million
of annual cost savings from operational and product
synergies, but importantly will also create a platform to
better serve our mid-market customers, both within
3