Cincinnati Bell 2012 Annual Report Download - page 160
Download and view the complete annual report
Please find page 160 of the 2012 Cincinnati Bell annual report below. You can navigate through the pages in the report by either clicking on the pages listed below, or by using the keyword search tool below to find specific information within the annual report.
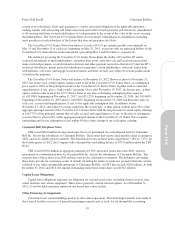
The following table summarizes the allocation of the assets acquired and liabilities assumed at the
acquisition date:
(dollars in millions)
Assets acquired
Receivables ...................................................................... $ 10.4
Other current assets ............................................................... 0.5
Property, plant and equipment ....................................................... 153.6
Goodwill ........................................................................ 269.6
Intangible assets .................................................................. 138.0
Other noncurrent assets ............................................................ 0.1
Total assets acquired .................................................................. 572.2
Liabilities assumed
Accounts payable ................................................................. 3.1
Unearned revenue and customer deposits .............................................. 7.7
Accrued taxes .................................................................... 1.5
Accrued payroll and benefits ........................................................ 0.7
Other current liabilities ............................................................ 0.8
Noncurrent liabilities .............................................................. 32.1
Total liabilities assumed ................................................................ 45.9
Net assets acquired ................................................................... $526.3
As required under ASC 805, we valued the assets acquired and liabilities assumed at fair value.
Management determined the fair value of property, plant and equipment, identifiable intangible assets and
noncurrent liabilities with the assistance of an independent valuation firm. All other fair value determinations
were made solely by management.
The following unaudited pro forma consolidated results assume the acquisition of Cyrus Networks was
completed as of the beginning of the year ended December 31, 2010:
(dollars in millions, except per share amounts) 2010
Revenue ........................................................................... $1,408.6
Net income ........................................................................ 23.3
Earnings per share:
Basic earnings per common share ................................................... $ 0.06
Diluted earnings per common share ................................................. 0.06
These results include adjustments related to the purchase price allocation and financing of the acquisition,
primarily to reduce revenue for the elimination of the unearned revenue liability in the opening balance sheet, to
increase depreciation and amortization associated with the higher values of property, plant and equipment and
identifiable intangible assets, to increase interest expense for the additional debt incurred to complete the
acquisition, and to reflect the related income tax effect and change in tax status. The pro forma information does
not necessarily reflect the actual results of operations had the acquisition been consummated at the beginning of
the annual reporting period indicated nor is it necessarily indicative of future operating results. The pro forma
information does not include any (i) potential revenue enhancements, cost synergies or other operating
efficiencies that could result from the acquisition or (ii) transaction or integration costs relating to the acquisition.
Disposition of Cincinnati Bell Complete Protection Inc. Assets
On August 1, 2011, we sold substantially all of the assets associated with our home security monitoring
business for $11.5 million. The pre-tax gain recognized on the sale of these assets was $8.4 million. The
operating results of this business, which were included within the Wireline segment prior to its sale, were
immaterial to our consolidated financial statements for the years ended December 31, 2011 and 2010.
86
Form 10-K Part II Cincinnati Bell Inc.


