Cincinnati Bell 2012 Annual Report Download - page 170
Download and view the complete annual report
Please find page 170 of the 2012 Cincinnati Bell annual report below. You can navigate through the pages in the report by either clicking on the pages listed below, or by using the keyword search tool below to find specific information within the annual report.-
 1
1 -
2
-
3
-
4
-
5
-
6
-
7
-
8
-
9
-
10
-
11
-
12
-
13
-
14
-
15
-
16
-
17
-
18
-
19
-
20
-
21
-
22
-
23
-
24
-
25
-
26
-
27
-
28
-
29
-
30
-
31
-
32
-
33
-
34
-
35
-
36
-
37
-
38
-
39
-
40
-
41
-
42
-
43
-
44
-
45
-
46
-
47
-
48
-
49
-
50
-
51
-
52
-
53
-
54
-
55
-
56
-
57
-
58
-
59
-
60
-
61
-
62
-
63
-
64
-
65
-
66
-
67
-
68
-
69
-
70
-
71
-
72
-
73
-
74
-
75
-
76
-
77
-
78
-
79
-
80
-
81
-
82
-
83
-
84
-
85
-
86
-
87
-
88
-
89
-
90
-
91
-
92
-
93
-
94
-
95
-
96
-
97
-
98
-
99
-
100
-
101
-
102
-
103
-
104
-
105
-
106
-
107
-
108
-
109
-
110
-
111
-
112
-
113
-
114
-
115
-
116
-
117
-
118
-
119
-
120
-
121
-
122
-
123
-
124
-
125
-
126
-
127
-
128
-
129
-
130
-
131
-
132
-
133
-
134
-
135
-
136
-
137
-
138
-
139
-
140
-
141
-
142
-
143
-
144
-
145
-
146
-
147
-
148
-
149
-
150
-
151
-
152
-
153
-
154
-
155
-
156
-
157
-
158
-
159
-
 160
160 -
 161
161 -
 162
162 -
 163
163 -
 164
164 -
 165
165 -
 166
166 -
 167
167 -
 168
168 -
 169
169 -
 170
170 -
 171
171 -
 172
172 -
 173
173 -
 174
174 -
 175
175 -
 176
176 -
 177
177 -
 178
178 -
 179
179 -
 180
180 -
181
-
182
-
183
-
184
-
185
-
186
-
187
-
188
-
189
-
190
-
191
-
192
-
193
-
194
-
195
-
196
-
197
-
198
-
199
-
200
-
201
-
202
-
203
-
204
-
205
-
206
-
207
-
208
-
209
-
210
-
211
-
212
-
213
-
214
-
215
-
216
 |
 |

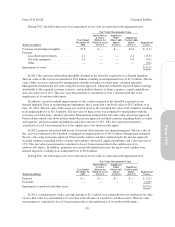
owner of these facilities. As of December 31, 2012 and 2011, the liability related to these financing arrangements
was $60.8 million and $47.9 million, respectively, which was recognized within “Other noncurrent liabilities” in
the Consolidated Balance Sheets.
The following table summarizes our annual minimum payments for these financing arrangements for the
five years subsequent to December 31, 2012, and thereafter:
(dollars in millions)
2013 .............................................................................. $ 6.0
2014 .............................................................................. 6.4
2015 .............................................................................. 6.6
2016 .............................................................................. 6.7
2017 .............................................................................. 6.9
Thereafter ......................................................................... 42.3
Total ............................................................................. $ 74.9
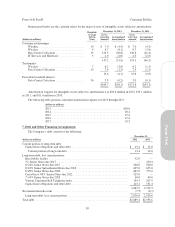
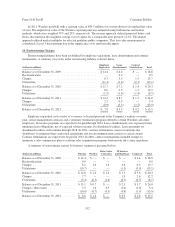
Debt Maturity Schedule
The following table summarizes our annual principal maturities of debt and capital leases for the five years
subsequent to December 31, 2012, and thereafter:
(dollars in millions) Debt
Capital
Leases
Total
Debt
Year ended December 31,
2013 ............................................................. $ 1.2 $ 12.2 $ 13.4
2014 ............................................................. 52.1 9.7 61.8
2015 ............................................................. 0.1 8.5 8.6
2016 ............................................................. — 9.0 9.0
2017 ............................................................. 500.0 5.2 505.2
Thereafter ......................................................... 2,008.4 90.5 2,098.9
2,561.8 135.1 2,696.9
Net unamortized discount ............................................. (7.5) — (7.5)
Total debt ......................................................... $2,554.3 $135.1 $2,689.4
Total capital lease payments including interest are expected to be $21.8 million for 2013, $18.5 million for
2014, $16.7 million for 2015, $16.6 million for 2016, $12.3 million for 2017, and $139.3 million thereafter.
Deferred Financing Costs
Deferred financing costs are costs incurred in connection with obtaining long-term financing. In 2012,
deferred financing costs were incurred in connection with the issuance of the Corporate Credit Agreement,
CyrusOne Credit Agreement and CyrusOne 6 3/8% Senior Notes due 2022. As of December 31, 2012 and 2011,
deferred financing costs totaled $47.1 million and $35.7 million, respectively. Deferred financing costs are
amortized over the term of the related indebtedness or credit agreement. Amortization of deferred financing
costs, included in “Interest expense” in the Consolidated Statements of Operations, totaled $7.2 million in 2012,
$7.0 million in 2011, and $6.6 million in 2010.
Debt Covenants
Credit Facility
The Corporate Credit Agreement has financial covenants that require the Company to maintain certain
leverage and interest coverage ratios. Capital expenditures are permitted subject to predetermined annual
thresholds which are not to exceed $955 million in the aggregate over the next five years. The Corporate Credit
Agreement also contains certain covenants which, among other things, restrict the Company’s ability to incur
96
Form 10-K Part II Cincinnati Bell Inc.