Cincinnati Bell 2012 Annual Report Download - page 108
Download and view the complete annual report
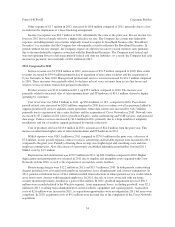
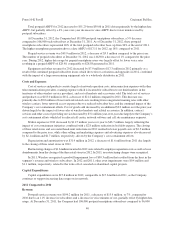
Please find page 108 of the 2012 Cincinnati Bell annual report below. You can navigate through the pages in the report by either clicking on the pages listed below, or by using the keyword search tool below to find specific information within the annual report.Other expense of $1.7 million in 2012, increased by $0.8 million compared to 2011, primarily due to a loss
recorded on the termination of a lease financing arrangement.
Income tax expense was $24.7 million in 2012, substantially the same as the prior year. Pre-tax income was
lower in 2012 but was largely offset by a higher effective tax rate. The Company has certain non-deductible
expenses, including interest on securities originally issued to acquire its broadband business (the “Broadband
Securities”) or securities that the Company has subsequently issued to refinance the Broadband Securities. In
periods without tax law changes, the Company expects its effective tax rate to exceed statutory rates primarily
due to the non-deductible expenses associated with the Broadband Securities. The Company used federal and
state net operating losses to defray payment of federal and state tax liabilities. As a result, the Company had cash
income tax payments, net of refunds, of $0.1 million in 2012.
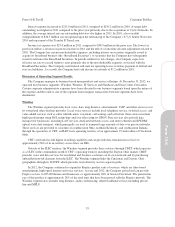
2011 Compared to 2010
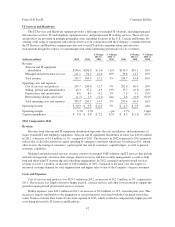
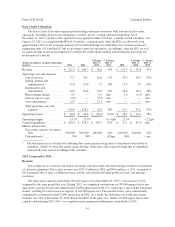
Service revenue was $1,250.8 million in 2011, an increase of $51.5 million compared to 2010. Data center
revenues increased by $59.4 million primarily due to expansion of data center facilities and the acquisition of
Cyrus Networks in June 2010. Managed and professional services revenue increased by $14.7 million compared
to 2010. These increases were partially offset by declines in local voice revenues from access line losses and
wireless service revenues from lower postpaid subscribers.
Product revenue was $211.6 million in 2011, up $33.9 million compared to 2010. The increase was
primarily related to increased sales of telecommunications and IT hardware of $31.1 million, driven by higher
spending by customers.
Cost of services was $464.3 million in 2011, up $50.4 million, or 12%, compared to 2010. Payroll and
payroll related costs increased by $20.1 million compared to 2010 due to overtime as well as personnel added to
support growth in IT services and data center operations. Other data center costs increased by $18.7 million
primarily due to expansion of data center facilities and the acquisition of Cyrus Networks in 2010. Network costs
increased by $7.2 million in 2011 due to growth in Fioptics, audio conferencing and VoIP services, and increased
data usage. Contract services increased by $2.3 million in 2011 primarily due to a large number of telephony
installations and out-of-territory support performed by outside contractors.
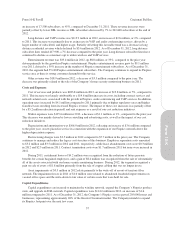
Cost of products sold was $213.0 million in 2011, an increase of $22.4 million from the prior year. This
increase resulted from higher sales of telecommunications and IT hardware in 2011.
SG&A expenses were $263.1 million in 2011 compared to $270.9 million in the prior year, a decrease of
$7.8 million. Lower payroll expense, contract services, advertising and bad debt expense were incurred in 2011
compared to the prior year. Partially offsetting these savings were higher legal and consulting costs and non-
employee commissions. Also, the release of a previously established indemnification liability lowered 2011
SG&A costs by $1.2 million.
Depreciation and amortization was $199.5 million in 2011, up $20.0 million compared to 2010. Higher
depreciation and amortization was incurred in 2011 due to tangible and intangible assets acquired with Cyrus
Networks in June 2010, as well as the expansion of several data center facilities.
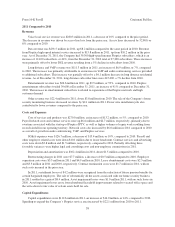
Restructuring charges were $12.2 million in 2011 and $13.7 million in 2010. In both periods, restructuring
charges included costs associated with employee separations, lease abandonments and contract terminations. In
2011, pension curtailment losses of $4.2 million resulted from reductions in future pension service credits which
arose from a new contract with bargained employees. In 2011, the sale of assets associated with our home
security monitoring business resulted in a gain of $8.4 million. In 2011, goodwill impairment losses of $50.3
million were recorded related to the Wireless segment. Asset impairment losses, excluding goodwill, were $2.1
million in 2011, resulting from abandonment of certain facilities, equipment, and capital projects. Acquisition
costs of $2.6 million were incurred in 2011, as acquisition opportunities were investigated in 2011 but none were
completed. In 2010, acquisition costs of $9.1 million were incurred due to the completion of the Cyrus Networks
acquisition.
34
Form 10-K Part II Cincinnati Bell Inc.


