Cincinnati Bell 2012 Annual Report Download - page 61
Download and view the complete annual report
Please find page 61 of the 2012 Cincinnati Bell annual report below. You can navigate through the pages in the report by either clicking on the pages listed below, or by using the keyword search tool below to find specific information within the annual report.-
 1
1 -
2
-
3
-
4
-
5
-
6
-
7
-
8
-
9
-
10
-
11
-
12
-
13
-
14
-
15
-
16
-
17
-
18
-
19
-
20
-
21
-
22
-
23
-
24
-
25
-
26
-
27
-
28
-
29
-
30
-
31
-
32
-
33
-
34
-
35
-
36
-
37
-
38
-
39
-
40
-
41
-
42
-
43
-
44
-
45
-
46
-
47
-
48
-
49
-
50
-
 51
51 -
 52
52 -
 53
53 -
 54
54 -
 55
55 -
 56
56 -
 57
57 -
 58
58 -
 59
59 -
 60
60 -
 61
61 -
 62
62 -
 63
63 -
 64
64 -
 65
65 -
 66
66 -
 67
67 -
 68
68 -
 69
69 -
 70
70 -
 71
71 -
72
-
73
-
74
-
75
-
76
-
77
-
78
-
79
-
80
-
81
-
82
-
83
-
84
-
85
-
86
-
87
-
88
-
89
-
90
-
91
-
92
-
93
-
94
-
95
-
96
-
97
-
98
-
99
-
100
-
101
-
102
-
103
-
104
-
105
-
106
-
107
-
108
-
109
-
110
-
111
-
112
-
113
-
114
-
115
-
116
-
117
-
118
-
119
-
120
-
121
-
122
-
123
-
124
-
125
-
126
-
127
-
128
-
129
-
130
-
131
-
132
-
133
-
134
-
135
-
136
-
137
-
138
-
139
-
140
-
141
-
142
-
143
-
144
-
145
-
146
-
147
-
148
-
149
-
150
-
151
-
152
-
153
-
154
-
155
-
156
-
157
-
158
-
159
-
160
-
161
-
162
-
163
-
164
-
165
-
166
-
167
-
168
-
169
-
170
-
171
-
172
-
173
-
174
-
175
-
176
-
177
-
178
-
179
-
180
-
181
-
182
-
183
-
184
-
185
-
186
-
187
-
188
-
189
-
190
-
191
-
192
-
193
-
194
-
195
-
196
-
197
-
198
-
199
-
200
-
201
-
202
-
203
-
204
-
205
-
206
-
207
-
208
-
209
-
210
-
211
-
212
-
213
-
214
-
215
-
216
 |
 |

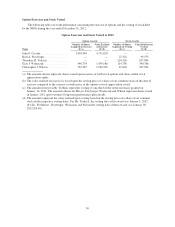
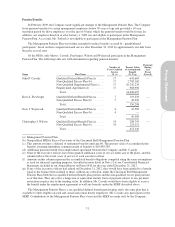
Outstanding Equity Awards at Fiscal Year End
The following table sets forth information concerning options and other equity awards held by the NEOs at
December 31, 2012:
Option Awards Stock Awards
Name
Number of
Securities
Underlying
Unexercised
Option (#)
Exercisable
Number of
Securities
Underlying
Unexercised
Option (#)
Unexercisable
(a)
Equity
Incentive Plan
Awards:
Number of
Securities
Underlying
Unexercised
Unearned
Options (#)
Option
Exercise
Price
($)
Option
Expiration
Date (b)
Number of
Shares or
Units of
Stocks That
Have Not
Vested
(#) (c)
Market
Value of
Shares or
Units of
Stocks That
Have Not
Vested
($)
Equity
Incentive
Plan Awards:
Number of
Unearned
Shares, Units
or Other
Rights That
Have Not
Vested
(#) (d)
Equity
Incentive
Plan Awards:
Market or
Payout Value
of Unearned
Shares, Units
or Other
Rights That
Have Not
Vested
($) (e)
John F.
Cassidy (f) ...... 801,000 — 5.66 12/4/2013
666,100 — 3.70 12/3/2014
425,000 — 4.00 12/1/2015
85,000 — 3.49 1/27/2016
574,350 — 4.74 12/8/2016
559,355 — 4.91 12/7/2017
680,000 — 1.67 12/5/2018
591,124 18,282 2.91 1/29/2020
481,080 307,576 2.85 1/28/2021
— 988,637 3.40 1/27/2022
— — 447,795 2,453,917
Kurt A.
Freyberger ...... 15,000 — 4.21 3/31/2015
20,000 — 4.00 12/1/2015
25,000 — 4.74 12/8/2016
25,000 — 4.91 12/7/2017
54,856 — 1.67 12/5/2018
18,222 — 1.39 1/30/2019
32,182 995 2.91 1/29/2020
45,713 22,515 2.54 12/7/2020
— 243,507 3.40 1/27/2022
— — 143,145 784,435
Theodore H.
Torbeck ........ — — — — 994,301 5,448,769 — —
Gary J.
Wojtaszek (g) . . . 83,590 — 1.67 12/5/2018
207,352 — 1.39 1/30/2019
204,946 6,338 2.91 1/29/2020
108,428 87,883 2.54 12/7/2020
— 243,507 3.40 1/27/2022
— — 228,882 1,254,273
Christopher J.
Wilson ......... 51,000 — 5.66 12/4/2013
24,726 6,181 2.91 1/29/2020
26,412 58,104 2.54 12/7/2020
— 194,805 3.40 1/27/2022
— — 178,884 980,284
(a) These awards, with the exception of awards expiring January 27, 2022, vest 28% on the first anniversary of the original date of grant and,
thereafter, at the rate of 3% per month for the next 24 months. The options and SARs awards expiring January 27, 2022 are performance-
based and vest 50% on the first anniversary, and 25% on the second and third anniversaries if the performance condition is achieved. The
amounts shown above for the 2012 awards reflect payout at the maximum level.
(b) All options and SARs granted are for a maximum period of ten years from the date of grant and vest over a three-year period.
(c) These awards represent restricted shares granted to Mr. Torbeck on January 3, 2012.
(d) Amounts in the column include performance shares granted for the 2010 – 2012 performance cycle less performance units earned and
vested for (i) the 2010 period on February 28, 2011 and (ii) the 2010-2011 cumulative period on February 28, 2012. Amounts also include
performance units granted for the 2011 – 2013 performance cycle less performance units earned and vested for the 2011 period on
February 28, 2012. The amount also includes the performance unit grant made to each of the executives for the 2012 – 2014 performance
cycle on January 28, 2012. These awards are performance-based and the amounts shown above reflect payout at the maximum level.
(e) Assuming the maximum number of shares is earned, amounts represent the equity incentive plan awards not yet vested. The value is
based on the closing price of the Company’s common shares as of December 31, 2012 ($5.48).
(f) Mr. Cassidy retired effective January 31, 2013 but will continue to vest in his options and stock awards.
(g) Mr. Wojtaszek resigned effective January 23, 2013 and forfeited all hisoptionawardsandstockawardsthatremainedunvestedatthattime.
49
Proxy Statement