Albertsons 2008 Annual Report Download - page 97
Download and view the complete annual report
Please find page 97 of the 2008 Albertsons annual report below. You can navigate through the pages in the report by either clicking on the pages listed below, or by using the keyword search tool below to find specific information within the annual report.-
 1
1 -
2
-
3
-
4
-
5
-
6
-
7
-
8
-
9
-
10
-
11
-
12
-
13
-
14
-
15
-
16
-
17
-
18
-
19
-
20
-
21
-
22
-
23
-
24
-
25
-
26
-
27
-
28
-
29
-
30
-
31
-
32
-
33
-
34
-
35
-
36
-
37
-
38
-
39
-
40
-
41
-
42
-
43
-
44
-
45
-
46
-
47
-
48
-
49
-
50
-
51
-
52
-
53
-
54
-
55
-
56
-
57
-
58
-
59
-
60
-
61
-
62
-
63
-
64
-
65
-
66
-
67
-
68
-
69
-
70
-
71
-
72
-
73
-
74
-
75
-
76
-
77
-
78
-
79
-
80
-
81
-
82
-
83
-
84
-
85
-
86
-
 87
87 -
 88
88 -
 89
89 -
 90
90 -
 91
91 -
 92
92 -
 93
93 -
 94
94 -
 95
95 -
 96
96 -
 97
97 -
 98
98 -
 99
99 -
 100
100 -
 101
101 -
 102
102 -
 103
103 -
 104
104 -
 105
105 -
 106
106 -
 107
107 -
108
-
109
-
110
-
111
-
112
-
113
-
114
-
115
-
116
 |
 |

SUPERVALU INC. and Subsidiaries
NOTES TO CONSOLIDATED FINANCIAL STATEMENTS—(Continued)
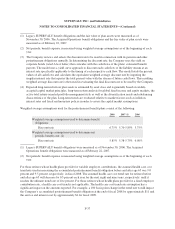
corresponding to the estimated expected term of such stock options. The Company believes this approach to
determine volatility is representative of future stock volatility. The expected term of a stock option is estimated
based on analysis of stock options already exercised and foreseeable trends or changes in behavior. The risk-free
interest rates are based on the U.S. Treasury securities maturities as of each applicable grant date. The dividend
yield is based on analysis of actual historical dividend yield.
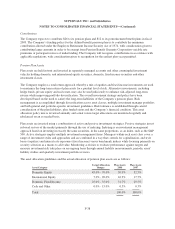
The significant weighted average assumptions relating to the valuation of the Company’s stock options were as
follows:
2008 2007 2006
Dividend yield 2.0% 2.0% 2.0%
Volatility rate 19.1 - 30.8% 20.6 - 29.5% 28.9%
Risk-free interest rate 3.0 - 5.1% 4.5 - 5.2% 3.9%
Expected option life 1.0 - 5.5 years 1.0 - 5.4 years 4.8 years
Restricted Stock Awards
Restricted stock award activity was as follows:
Restricted
Stock
Weighted Average
Grant-Date
Fair Value
(In thousands)
Outstanding, February 24, 2007 1,539 $28.91
Granted 51 37.19
Lapsed (646) 29.69
Canceled and forfeited (25) 21.12
Outstanding, February 23, 2008 919 $28.97
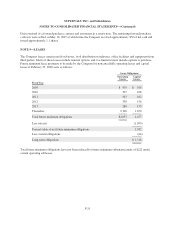
Compensation Expense
The components of pre-tax stock-based compensation expense (included primarily in Selling and administrative
expenses in the Consolidated Statements of Earnings) and related tax benefits were as follows:
2008 2007 2006
Stock-based compensation $ 52 $ 43 $ 3
Income tax benefits (20) (17) (1)
Stock-based compensation (net of tax) $ 32 $ 26 $ 2
The Company realized excess tax benefits of $20 and $22 related to the exercise of stock-based awards during
fiscal 2008 and 2007, respectively.
Unrecognized Compensation Expense
As of February 23, 2008, there was $55 of unrecognized compensation expense related to unvested stock-based
awards granted under the Company’s stock plans. The expense is expected to be recognized over a weighted
average remaining vesting period of approximately two years.
F-31