Albertsons 2008 Annual Report Download - page 68
Download and view the complete annual report
Please find page 68 of the 2008 Albertsons annual report below. You can navigate through the pages in the report by either clicking on the pages listed below, or by using the keyword search tool below to find specific information within the annual report.-
 1
1 -
2
-
3
-
4
-
5
-
6
-
7
-
8
-
9
-
10
-
11
-
12
-
13
-
14
-
15
-
16
-
17
-
18
-
19
-
20
-
21
-
22
-
23
-
24
-
25
-
26
-
27
-
28
-
29
-
30
-
31
-
32
-
33
-
34
-
35
-
36
-
37
-
38
-
39
-
40
-
41
-
42
-
43
-
44
-
45
-
46
-
47
-
48
-
49
-
50
-
51
-
52
-
53
-
54
-
55
-
56
-
57
-
 58
58 -
 59
59 -
 60
60 -
 61
61 -
 62
62 -
 63
63 -
 64
64 -
 65
65 -
 66
66 -
 67
67 -
 68
68 -
 69
69 -
 70
70 -
 71
71 -
 72
72 -
 73
73 -
 74
74 -
 75
75 -
 76
76 -
 77
77 -
 78
78 -
79
-
80
-
81
-
82
-
83
-
84
-
85
-
86
-
87
-
88
-
89
-
90
-
91
-
92
-
93
-
94
-
95
-
96
-
97
-
98
-
99
-
100
-
101
-
102
-
103
-
104
-
105
-
106
-
107
-
108
-
109
-
110
-
111
-
112
-
113
-
114
-
115
-
116
 |
 |

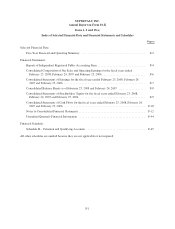
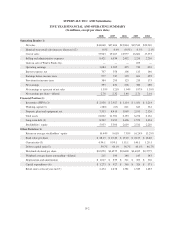
SUPERVALU INC. AND Subsidiaries
FIVE YEAR FINANCIAL AND OPERATING SUMMARY
(In millions, except per share data)
2008 2007 2006 2005 2004
Operating Results (1)
Net sales $44,048 $37,406 $19,864 $19,543 $20,210
Identical store retail sales increase (decrease) (2) 0.5% 0.4% (0.5%) 0.3% 2.1%
Cost of sales 33,943 29,267 16,977 16,681 17,373
Selling and administrative expenses 8,421 6,834 2,452 2,255 2,236
Gain on sale of WinCo Foods, Inc. — — — 109 —
Operating earnings 1,684 1,305 435 716 601
Interest expense, net 707 558 106 115 146
Earnings before income taxes 977 747 329 601 455
Provision for income taxes 384 295 123 215 175
Net earnings 593 452 206 386 280
Net earnings as a percent of net sales 1.35% 1.21% 1.04% 1.97% 1.39%
Net earnings per share—diluted 2.76 2.32 1.46 2.71 2.01
Financial Position (1)
Inventories (FIFO) (3) $ 2,956 $ 2,927 $ 1,114 $ 1,181 $ 1,214
Working capital (3) (280) (67) 821 643 361
Property, plant and equipment, net 7,533 8,415 1,969 2,191 2,126
Total assets 21,062 21,702 6,153 6,274 6,162
Long-term debt (4) 8,502 9,192 1,406 1,579 1,634
Stockholders’ equity 5,953 5,306 2,619 2,511 2,210
Other Statistics (1)
Return on average stockholders’ equity 10.44% 9.61% 7.95% 16.24% 13.29%
Book value per share $ 28.13 $ 25.40 $ 19.20 $ 18.53 $ 16.40
Current ratio (3) 0.94:1 0.99:1 1.51:1 1.40:1 1.20:1
Debt to capital ratio (5) 59.7% 64.1% 36.7% 40.1% 46.7%
Dividends declared per share $0.6750 $0.6575 $0.6400 $0.6025 $0.5775
Weighted average shares outstanding—diluted 215 196 146 145 143
Depreciation and amortization $ 1,017 $ 879 $ 311 $ 303 $ 302
Capital expenditures (6) $ 1,273 $ 927 $ 365 $ 326 $ 371
Retail stores at fiscal year end (7) 2,474 2,478 1,381 1,549 1,483
F-2