Albertsons 2008 Annual Report Download - page 28
Download and view the complete annual report
Please find page 28 of the 2008 Albertsons annual report below. You can navigate through the pages in the report by either clicking on the pages listed below, or by using the keyword search tool below to find specific information within the annual report.-
 1
1 -
2
-
3
-
4
-
5
-
6
-
7
-
8
-
9
-
10
-
11
-
12
-
13
-
14
-
15
-
16
-
17
-
 18
18 -
 19
19 -
 20
20 -
 21
21 -
 22
22 -
 23
23 -
 24
24 -
 25
25 -
 26
26 -
 27
27 -
 28
28 -
 29
29 -
 30
30 -
 31
31 -
 32
32 -
 33
33 -
 34
34 -
 35
35 -
 36
36 -
 37
37 -
 38
38 -
39
-
40
-
41
-
42
-
43
-
44
-
45
-
46
-
47
-
48
-
49
-
50
-
51
-
52
-
53
-
54
-
55
-
56
-
57
-
58
-
59
-
60
-
61
-
62
-
63
-
64
-
65
-
66
-
67
-
68
-
69
-
70
-
71
-
72
-
73
-
74
-
75
-
76
-
77
-
78
-
79
-
80
-
81
-
82
-
83
-
84
-
85
-
86
-
87
-
88
-
89
-
90
-
91
-
92
-
93
-
94
-
95
-
96
-
97
-
98
-
99
-
100
-
101
-
102
-
103
-
104
-
105
-
106
-
107
-
108
-
109
-
110
-
111
-
112
-
113
-
114
-
115
-
116
 |
 |
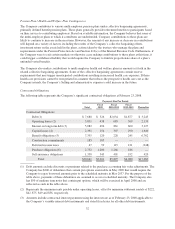
Retail food sales for fiscal 2008 were $34,341, compared with $28,016 last year, an increase of 22.6 percent. The
increase was due primarily to the Acquisition. Identical store retail sales growth (defined as stores operating for
four full quarters, including store expansions and excluding fuel and planned store closures) for fiscal 2008, as
compared to fiscal 2007, was 0.1 percent. Identical store retail sales growth on a combined basis, as if the
Acquired Operations stores were in the store base for four full quarters, was 0.5 percent.
During fiscal 2008, the Company added 73 new stores through new store development, acquired eight stores and
closed 85 stores, 28 of which were acquired through the Acquisition.
Total retail square footage at the end of fiscal 2008 was approximately 71 million, a decrease of 2.5 percent from
the end of fiscal 2007. Total retail square footage, excluding store closures, increased 2.3 percent from the end of
fiscal 2007.
Supply chain services sales for fiscal 2008 were $9,707, compared with $9,390 last year, an increase of 3.4
percent. This increase primarily reflects new business growth, which was partially offset by customer attrition.
Gross Profit
Gross profit, as a percent of Net sales, was 22.9 percent for fiscal 2008 compared with 21.8 percent last year. The
increase in Gross profit, as a percent of Net sales, is primarily due to the impact of the Acquisition on business
segment mix which includes 52 weeks of results of the Acquired Operations in fiscal 2008 compared with 38
weeks last year. The Acquired Operations are part of the Retail food segment which has a higher Gross profit
percentage than Supply chain services.
Selling and Administrative Expenses
Selling and administrative expenses, as a percent of Net sales, were 19.1 percent for fiscal 2008, compared with
18.3 percent last year. The increase in Selling and administrative expenses, as a percent of Net sales, is primarily
due to the impact of the Acquisition on the business segment mix which includes 52 weeks of results of the
Acquired Operations in fiscal 2008 compared with 38 weeks last year. The Acquired Operations are part of the
Retail food segment which has a higher Selling and administrative expenses percentage than Supply chain
services. The impact of the business segment mix more than offset the decrease in employee-related costs and
lower depreciation expense as a percent of Net sales.
Operating Earnings
Operating earnings for fiscal 2008 increased to $1,684, compared with $1,305 last year, primarily reflecting the
results from the Acquisition. Retail food Operating earnings for fiscal 2008 were $1,550, or 4.5 percent of Retail
food sales, compared with $1,179, or 4.2 percent of Retail food sales, for fiscal 2007, primarily reflecting the
results from the Acquisition. Supply chain services Operating earnings for fiscal 2008 were $274, or 2.8 percent
of Supply chain services sales, compared with $257, or 2.7 percent of Supply chain services sales, for fiscal
2007.
Net Interest Expense
Net interest expense was $707 in fiscal 2008, compared with $558 last year. The increase primarily reflects
interest expense related to assumed debt and new borrowings related to the Acquisition.
Provision for Income Taxes
The effective tax rates were 39.3 percent and 39.5 percent in fiscal 2008 and fiscal 2007, respectively.
22