Albertsons 2008 Annual Report Download - page 72
Download and view the complete annual report
Please find page 72 of the 2008 Albertsons annual report below. You can navigate through the pages in the report by either clicking on the pages listed below, or by using the keyword search tool below to find specific information within the annual report.-
 1
1 -
2
-
3
-
4
-
5
-
6
-
7
-
8
-
9
-
10
-
11
-
12
-
13
-
14
-
15
-
16
-
17
-
18
-
19
-
20
-
21
-
22
-
23
-
24
-
25
-
26
-
27
-
28
-
29
-
30
-
31
-
32
-
33
-
34
-
35
-
36
-
37
-
38
-
39
-
40
-
41
-
42
-
43
-
44
-
45
-
46
-
47
-
48
-
49
-
50
-
51
-
52
-
53
-
54
-
55
-
56
-
57
-
58
-
59
-
60
-
61
-
 62
62 -
 63
63 -
 64
64 -
 65
65 -
 66
66 -
 67
67 -
 68
68 -
 69
69 -
 70
70 -
 71
71 -
 72
72 -
 73
73 -
 74
74 -
 75
75 -
 76
76 -
 77
77 -
 78
78 -
 79
79 -
 80
80 -
 81
81 -
 82
82 -
83
-
84
-
85
-
86
-
87
-
88
-
89
-
90
-
91
-
92
-
93
-
94
-
95
-
96
-
97
-
98
-
99
-
100
-
101
-
102
-
103
-
104
-
105
-
106
-
107
-
108
-
109
-
110
-
111
-
112
-
113
-
114
-
115
-
116
 |
 |
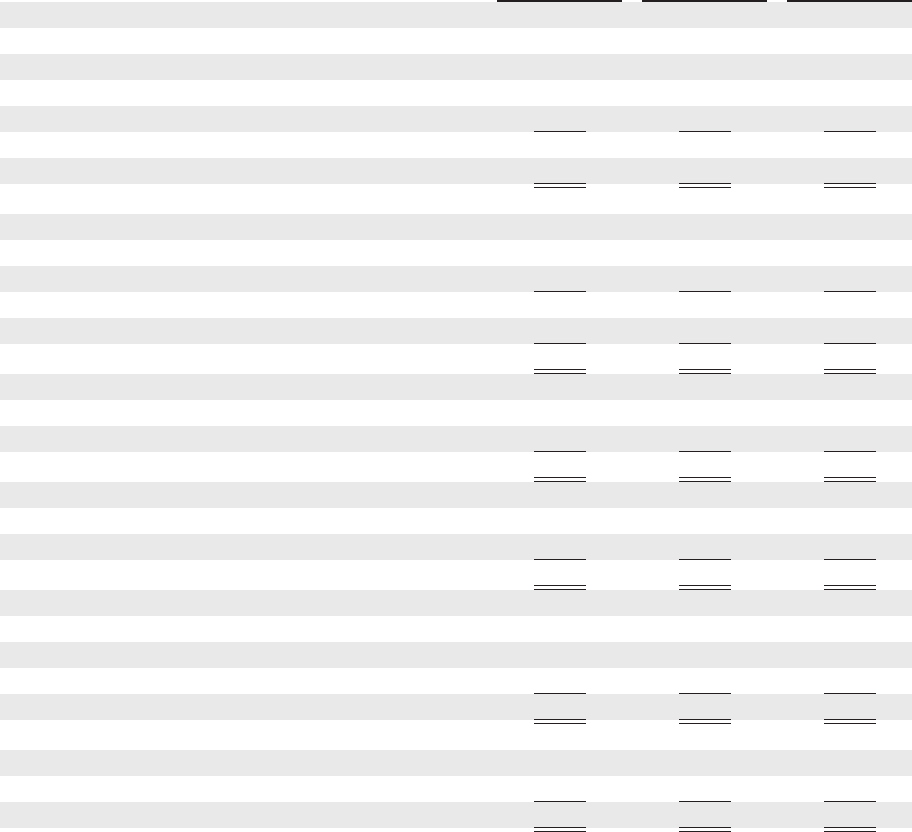
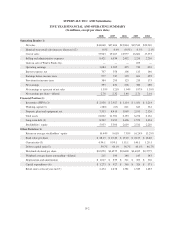
SUPERVALU INC. and Subsidiaries
CONSOLIDATED COMPOSITION OF NET SALES AND OPERATING EARNINGS
(In millions)
February 23, 2008
(52 weeks)
February 24, 2007
(52 weeks)
February 25, 2006
(52 weeks)
Net sales
Retail food $34,341 $28,016 $10,635
78.0% 74.9% 53.5%
Supply chain services 9,707 9,390 9,229
22.0% 25.1% 46.5%
Total net sales $44,048 $37,406 $19,864
100.0% 100.0% 100.0%
Operating earnings
Retail food $ 1,550 $ 1,179 $ 269
Supply chain services 274 257 214
Corporate (140) (131) (48)
Total operating earnings 1,684 1,305 435
Interest expense, net (707) (558) (106)
Earnings before income taxes $ 977 $ 747 $ 329
Depreciation and amortization
Retail food $ 922 $ 783 $ 216
Supply chain services 95 96 95
Total $ 1,017 $ 879 $ 311
Capital expenditures
Retail food $ 1,212 $ 824 $ 249
Supply chain services 61 103 116
Total $ 1,273 $ 927 $ 365
Identifiable assets
Retail food $18,265 $18,949 $ 2,858
Supply chain services 2,608 2,697 2,614
Corporate 189 56 681
Total $21,062 $21,702 $ 6,153
Goodwill
Retail food $ 6,152 $ 5,103 $ 803
Supply chain services 805 818 811
Total $ 6,957 $ 5,921 $ 1,614
The Company’s business is classified by management into two reportable segments: Retail food and Supply
chain services. Retail food operations include results of the Company’s own combination stores (defined as food
and pharmacy), food stores and limited assortment food stores and results of sales to limited assortment food
stores licensed by the Company. Supply chain services operations include results of wholesale distribution to
affiliated food stores, mass merchants and other customers and logistics support services. Substantially all of the
Company’s operations are domestic.
See Notes to Consolidated Financial Statements.
F-6