Albertsons 2008 Annual Report Download - page 76
Download and view the complete annual report
Please find page 76 of the 2008 Albertsons annual report below. You can navigate through the pages in the report by either clicking on the pages listed below, or by using the keyword search tool below to find specific information within the annual report.-
 1
1 -
2
-
3
-
4
-
5
-
6
-
7
-
8
-
9
-
10
-
11
-
12
-
13
-
14
-
15
-
16
-
17
-
18
-
19
-
20
-
21
-
22
-
23
-
24
-
25
-
26
-
27
-
28
-
29
-
30
-
31
-
32
-
33
-
34
-
35
-
36
-
37
-
38
-
39
-
40
-
41
-
42
-
43
-
44
-
45
-
46
-
47
-
48
-
49
-
50
-
51
-
52
-
53
-
54
-
55
-
56
-
57
-
58
-
59
-
60
-
61
-
62
-
63
-
64
-
65
-
 66
66 -
 67
67 -
 68
68 -
 69
69 -
 70
70 -
 71
71 -
 72
72 -
 73
73 -
 74
74 -
 75
75 -
 76
76 -
 77
77 -
 78
78 -
 79
79 -
 80
80 -
 81
81 -
 82
82 -
 83
83 -
 84
84 -
 85
85 -
 86
86 -
87
-
88
-
89
-
90
-
91
-
92
-
93
-
94
-
95
-
96
-
97
-
98
-
99
-
100
-
101
-
102
-
103
-
104
-
105
-
106
-
107
-
108
-
109
-
110
-
111
-
112
-
113
-
114
-
115
-
116
 |
 |

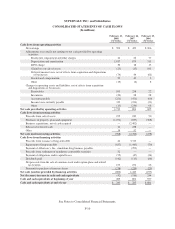
SUPERVALU INC. and Subsidiaries
CONSOLIDATED STATEMENTS OF CASH FLOWS
(In millions)
February 23,
2008
(52 weeks)
February 24,
2007
(52 weeks)
February 25,
2006
(52 weeks)
Cash flows from operating activities
Net earnings $ 593 $ 452 $ 206
Adjustments to reconcile net earnings to net cash provided by operating
activities:
Restructure, impairment and other charges 14 26 77
Depreciation and amortization 1,017 879 311
LIFO charge 30 18 13
(Gain) loss on sale of assets (23) (15) 101
Deferred income taxes, net of effects from acquisition and dispositions
of businesses (74) 44 (61)
Stock-based compensation 52 42 3
Other (15) (6) 8
Changes in operating assets and liabilities, net of effects from acquisition
and dispositions of businesses:
Receivables 103 258 22
Inventories (20) 28 28
Accounts payable (251) (471) (60)
Income taxes currently payable 319 (224) (21)
Other (13) (230) 68
Net cash provided by operating activities 1,732 801 695
Cash flows from investing activities
Proceeds from sale of assets 195 189 50
Purchases of property, plant and equipment (1,191) (837) (308)
Business acquisitions, net of cash acquired — (2,402) —
Release of restricted cash 14 238 —
Other 14 52 —
Net cash used in investing activities (968) (2,760) (258)
Cash flows from financing activities
Proceeds from issuance of long-term debt 41 3,313 —
Repayment of long-term debt (637) (1,443) (70)
Payment of Albertson’s, Inc. standalone drug business payables — (299) —
Proceeds from settlement of mandatory convertible securities 52 — —
Payment of obligations under capital leases (55) (47) (34)
Dividends paid (142) (113) (86)
Net proceeds from the sale of common stock under option plans and related
tax benefits 153 252 26
Payment for purchase of treasury shares (218) (220) (29)
Net cash (used in) provided by financing activities (806) 1,443 (193)
Net (decrease) increase in cash and cash equivalents (42) (516) 244
Cash and cash equivalents at beginning of year 285 801 557
Cash and cash equivalents at end of year $ 243 $ 285 $ 801
See Notes to Consolidated Financial Statements.
F-10