Albertsons 2008 Annual Report Download - page 2
Download and view the complete annual report
Please find page 2 of the 2008 Albertsons annual report below. You can navigate through the pages in the report by either clicking on the pages listed below, or by using the keyword search tool below to find specific information within the annual report.-
 1
1 -
 2
2 -
 3
3 -
 4
4 -
 5
5 -
 6
6 -
 7
7 -
 8
8 -
 9
9 -
 10
10 -
 11
11 -
 12
12 -
 13
13 -
14
-
15
-
16
-
17
-
18
-
19
-
20
-
21
-
22
-
23
-
24
-
25
-
26
-
27
-
28
-
29
-
30
-
31
-
32
-
33
-
34
-
35
-
36
-
37
-
38
-
39
-
40
-
41
-
42
-
43
-
44
-
45
-
46
-
47
-
48
-
49
-
50
-
51
-
52
-
53
-
54
-
55
-
56
-
57
-
58
-
59
-
60
-
61
-
62
-
63
-
64
-
65
-
66
-
67
-
68
-
69
-
70
-
71
-
72
-
73
-
74
-
75
-
76
-
77
-
78
-
79
-
80
-
81
-
82
-
83
-
84
-
85
-
86
-
87
-
88
-
89
-
90
-
91
-
92
-
93
-
94
-
95
-
96
-
97
-
98
-
99
-
100
-
101
-
102
-
103
-
104
-
105
-
106
-
107
-
108
-
109
-
110
-
111
-
112
-
113
-
114
-
115
-
116
 |
 |
Creating long-term, sustainable
success. This is SUPERVALU’s
pledge to shareholders, and
we’re working on it every day.
From creating stores that are
appealing and convenient to
our customers to providing
them with the freshest and
most sought after foods, we are
focused on “turning the dining
room lights back on” by making
it easier to cook great meals at
home. Accomplishing this is
no small feat. Our innovative
merchants across the country
ensure that we fully leverage
our nationwide scale, and at
the same time make sure that
each store is tuned into the
preferences of the shoppers
who walk through our doors
every day.
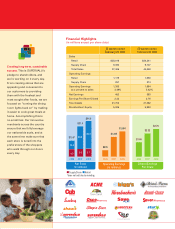
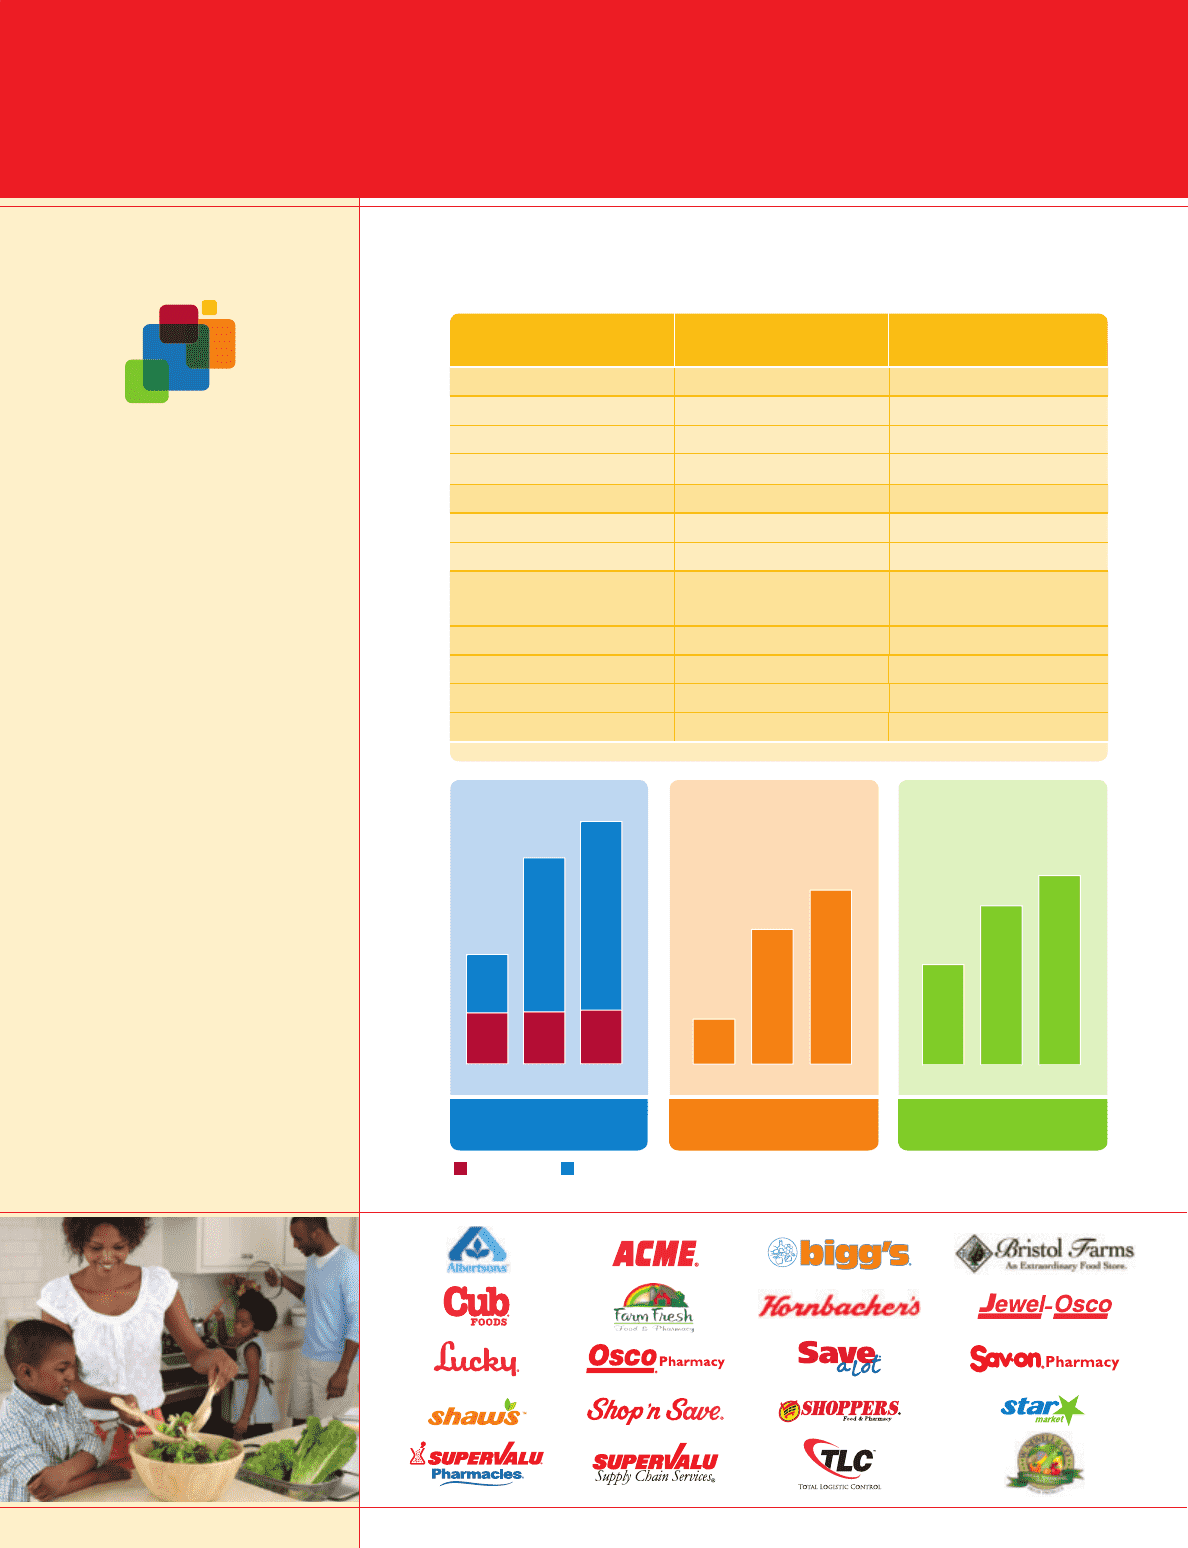
2006
$44.0
$37.4
$19.9*
2007 2008
Net Sales
(in millions)
10.6
9.2 9.4 9.7
28.0
34.3
Diluted Earnings
Per Share
2006 2007
$2.76
$2.32
$1.46
2008
Operating Earnings
(in millions)
2006 2007
$1,305
$435
$1,684
2008
52 weeks ended
February 24, 2007
52 weeks ended
February 23 2008
Sales
Retail $28,016 $34,341
Supply Chain 9,390 9,707
Total Sales 37,406 44,048
Operating Earnings
Retail 1,179 1,550
Supply Chain 257 274
Operating Earnings
as a percent to sales
1,305
3.49%
1,684
3.82%
Net Earnings 452 593
Earnings Per Share-Diluted 2.32 2.76
Total Assets 21,702 21,062
Stockholders’ Equity 5,306 5,953
Financial Highlights
(in millions except per share data)
Supply Chain Retail
*does not add due to rounding