eBay 2005 Annual Report Download - page 86
Download and view the complete annual report
Please find page 86 of the 2005 eBay annual report below. You can navigate through the pages in the report by either clicking on the pages listed below, or by using the keyword search tool below to find specific information within the annual report.-
 1
1 -
2
-
3
-
4
-
5
-
6
-
7
-
8
-
9
-
10
-
11
-
12
-
13
-
14
-
15
-
16
-
17
-
18
-
19
-
20
-
21
-
22
-
23
-
24
-
25
-
26
-
27
-
28
-
29
-
30
-
31
-
32
-
33
-
34
-
35
-
36
-
37
-
38
-
39
-
40
-
41
-
42
-
43
-
44
-
45
-
46
-
47
-
48
-
49
-
50
-
51
-
52
-
53
-
54
-
55
-
56
-
57
-
58
-
59
-
60
-
61
-
62
-
63
-
64
-
65
-
66
-
67
-
68
-
69
-
70
-
71
-
72
-
73
-
74
-
75
-
 76
76 -
 77
77 -
 78
78 -
 79
79 -
 80
80 -
 81
81 -
 82
82 -
 83
83 -
 84
84 -
 85
85 -
 86
86 -
 87
87 -
 88
88 -
 89
89 -
 90
90 -
 91
91 -
 92
92 -
 93
93 -
 94
94 -
 95
95 -
 96
96 -
97
-
98
-
99
-
100
-
101
-
102
-
103
-
104
-
105
-
106
-
107
-
108
-
109
-
110
-
111
-
112
-
113
-
114
-
115
-
116
-
117
-
118
-
119
-
120
-
121
-
122
-
123
 |
 |

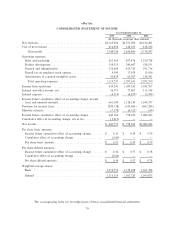
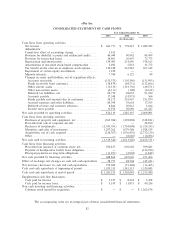
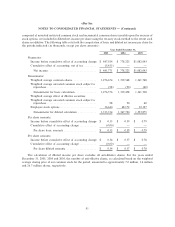
eBay Inc.
CONSOLIDATED STATEMENT OF CASH FLOWS
Year Ended December 31,
2003 2004 2005
(In thousands)
Cash flows from operating activities:
Net incomeÏÏÏÏÏÏÏÏÏÏÏÏÏÏÏÏÏÏÏÏÏÏÏÏÏÏÏÏÏÏÏÏÏÏÏÏÏÏÏÏÏ $ 441,771 $ 778,223 $ 1,082,043
Adjustments:
Cumulative effect of accounting change ÏÏÏÏÏÏÏÏÏÏÏÏÏÏÏÏÏ 5,413 Ì Ì
Provision for doubtful accounts and authorized credits ÏÏÏÏÏ 46,049 90,942 89,499
Provision for transaction losses ÏÏÏÏÏÏÏÏÏÏÏÏÏÏÏÏÏÏÏÏÏÏÏÏÏ 36,401 50,459 73,773
Depreciation and amortization ÏÏÏÏÏÏÏÏÏÏÏÏÏÏÏÏÏÏÏÏÏÏÏÏÏ 159,003 253,690 378,165
Amortization of unearned stock-based compensation ÏÏÏÏÏÏ 5,492 5,832 31,772
Tax benefit on the exercise of employee stock options ÏÏÏÏÏ 130,638 261,983 267,142
Impairment of certain equity investmentsÏÏÏÏÏÏÏÏÏÏÏÏÏÏÏÏ 1,230 Ì Ì
Minority interests ÏÏÏÏÏÏÏÏÏÏÏÏÏÏÏÏÏÏÏÏÏÏÏÏÏÏÏÏÏÏÏÏÏÏÏÏ 7,784 6,122 49
Changes in assets and liabilities, net of acquisition effects:
Accounts receivable ÏÏÏÏÏÏÏÏÏÏÏÏÏÏÏÏÏÏÏÏÏÏÏÏÏÏÏÏÏÏÏÏ (153,373) (105,540) (151,993)
Funds receivable from customers ÏÏÏÏÏÏÏÏÏÏÏÏÏÏÏÏÏÏÏÏÏ (38,879) (44,751) (132,606)
Other current assetsÏÏÏÏÏÏÏÏÏÏÏÏÏÏÏÏÏÏÏÏÏÏÏÏÏÏÏÏÏÏÏÏ (13,133) (312,756) (49,371)
Other non-current assets ÏÏÏÏÏÏÏÏÏÏÏÏÏÏÏÏÏÏÏÏÏÏÏÏÏÏÏÏ (4,111) (308) (4,612)
Deferred tax liabilities, net ÏÏÏÏÏÏÏÏÏÏÏÏÏÏÏÏÏÏÏÏÏÏÏÏÏÏ 69,770 28,652 91,690
Accounts payable ÏÏÏÏÏÏÏÏÏÏÏÏÏÏÏÏÏÏÏÏÏÏÏÏÏÏÏÏÏÏÏÏÏÏ 17,348 (33,975) 564
Funds payable and amounts due to customers ÏÏÏÏÏÏÏÏÏÏ 56,172 216,967 251,870
Accrued expenses and other liabilitiesÏÏÏÏÏÏÏÏÏÏÏÏÏÏÏÏÏ 85,704 39,618 17,013
Deferred revenue and customer advances ÏÏÏÏÏÏÏÏÏÏÏÏÏÏ 8,864 20,061 3,646
Income taxes payable ÏÏÏÏÏÏÏÏÏÏÏÏÏÏÏÏÏÏÏÏÏÏÏÏÏÏÏÏÏÏ 11,976 30,096 61,247
Net cash provided by operating activities ÏÏÏÏÏÏÏÏÏÏÏÏÏÏÏÏÏÏ 874,119 1,285,315 2,009,891
Cash flows from investing activities:
Purchases of property and equipment, net ÏÏÏÏÏÏÏÏÏÏÏÏÏÏÏ (365,384) (292,838) (338,281)
Proceeds from sale of corporate aircraft ÏÏÏÏÏÏÏÏÏÏÏÏÏÏÏÏÏ Ì Ì 28,290
Purchases of investments ÏÏÏÏÏÏÏÏÏÏÏÏÏÏÏÏÏÏÏÏÏÏÏÏÏÏÏÏÏ (2,035,053) (1,754,808) (1,324,353)
Maturities and sales of investments ÏÏÏÏÏÏÏÏÏÏÏÏÏÏÏÏÏÏÏÏÏ 1,297,262 1,079,548 1,928,539
Acquisitions, net of cash acquired ÏÏÏÏÏÏÏÏÏÏÏÏÏÏÏÏÏÏÏÏÏÏ (216,367) (1,036,476) (2,732,230)
Other ÏÏÏÏÏÏÏÏÏÏÏÏÏÏÏÏÏÏÏÏÏÏÏÏÏÏÏÏÏÏÏÏÏÏÏÏÏÏÏÏÏÏÏÏÏÏ Ì (8,646) (14,696)
Net cash used in investing activities ÏÏÏÏÏÏÏÏÏÏÏÏÏÏÏÏÏÏÏÏÏÏ (1,319,542) (2,013,220) (2,452,731)
Cash flows from financing activities:
Proceeds from issuance of common stock, net ÏÏÏÏÏÏÏÏÏÏÏÏ 700,817 650,638 599,845
Payment of headquarters facility lease obligationÏÏÏÏÏÏÏÏÏÏ Ì Ì (126,390)
Principal payments on long-term obligations ÏÏÏÏÏÏÏÏÏÏÏÏÏ (11,951) (2,969) (1,849)
Net cash provided by financing activities ÏÏÏÏÏÏÏÏÏÏÏÏÏÏÏÏÏÏ 688,866 647,669 471,606
Effect of exchange rate changes on cash and cash equivalents 28,757 28,768 (45,231)
Net increase (decrease) in cash and cash equivalents ÏÏÏÏÏÏÏ 272,200 (51,468) (16,465)
Cash and cash equivalents at beginning of period ÏÏÏÏÏÏÏÏÏÏÏ 1,109,313 1,381,513 1,330,045
Cash and cash equivalents at end of period ÏÏÏÏÏÏÏÏÏÏÏÏÏÏÏÏ $ 1,381,513 $ 1,330,045 $ 1,313,580
Supplemental cash flow disclosures:
Cash paid for interest ÏÏÏÏÏÏÏÏÏÏÏÏÏÏÏÏÏÏÏÏÏÏÏÏÏÏÏÏÏÏÏÏ $ 3,237 $ 8,234 $ 3,478
Cash paid for income taxesÏÏÏÏÏÏÏÏÏÏÏÏÏÏÏÏÏÏÏÏÏÏÏÏÏÏÏÏ $ 3,519 $ 13,875 $ 40,256
Non-cash investing and financing activities:
Common stock issued for acquisition ÏÏÏÏÏÏÏÏÏÏÏÏÏÏÏÏÏÏÏ $ Ì $ Ì $ 1,262,674
The accompanying notes are an integral part of these consolidated financial statements.
82