eBay 2005 Annual Report Download - page 106
Download and view the complete annual report
Please find page 106 of the 2005 eBay annual report below. You can navigate through the pages in the report by either clicking on the pages listed below, or by using the keyword search tool below to find specific information within the annual report.-
 1
1 -
2
-
3
-
4
-
5
-
6
-
7
-
8
-
9
-
10
-
11
-
12
-
13
-
14
-
15
-
16
-
17
-
18
-
19
-
20
-
21
-
22
-
23
-
24
-
25
-
26
-
27
-
28
-
29
-
30
-
31
-
32
-
33
-
34
-
35
-
36
-
37
-
38
-
39
-
40
-
41
-
42
-
43
-
44
-
45
-
46
-
47
-
48
-
49
-
50
-
51
-
52
-
53
-
54
-
55
-
56
-
57
-
58
-
59
-
60
-
61
-
62
-
63
-
64
-
65
-
66
-
67
-
68
-
69
-
70
-
71
-
72
-
73
-
74
-
75
-
76
-
77
-
78
-
79
-
80
-
81
-
82
-
83
-
84
-
85
-
86
-
87
-
88
-
89
-
90
-
91
-
92
-
93
-
94
-
95
-
 96
96 -
 97
97 -
 98
98 -
 99
99 -
 100
100 -
 101
101 -
 102
102 -
 103
103 -
 104
104 -
 105
105 -
 106
106 -
 107
107 -
 108
108 -
 109
109 -
 110
110 -
 111
111 -
 112
112 -
 113
113 -
 114
114 -
 115
115 -
 116
116 -
117
-
118
-
119
-
120
-
121
-
122
-
123
 |
 |

eBay Inc.
NOTES TO CONSOLIDATED FINANCIAL STATEMENTS Ì (Continued)
December 31, 2005
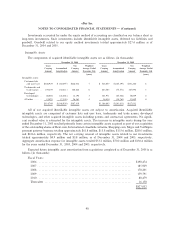
Gross Gross Gross
Amortized Unrealized Unrealized Estimated
Cost Gains Losses Fair Value
Short-term investments:
Restricted cash and investmentsÏÏÏÏÏÏÏÏÏÏÏÏÏ $ 29,670 $ 32 $ Ì $ 29,702
Corporate debt securitiesÏÏÏÏÏÏÏÏÏÏÏÏÏÏÏÏÏÏÏ 362,438 4 (2,679) 359,763
Government and agency securities ÏÏÏÏÏÏÏÏÏÏÏ 371,537 Ì (3,198) 368,339
Time deposits and other ÏÏÏÏÏÏÏÏÏÏÏÏÏÏÏÏÏÏÏ 46,548 Ì Ì 46,548
$810,193 $ 36 $(5,877) $804,352
Long-term investments:
Restricted cash and investmentsÏÏÏÏÏÏÏÏÏÏÏÏÏ $ 1,065 $ Ì $ Ì $ 1,065
Corporate debt securitiesÏÏÏÏÏÏÏÏÏÏÏÏÏÏÏÏÏÏÏ 665,418 115 (1,921) 663,612
Government and agency securities ÏÏÏÏÏÏÏÏÏÏÏ 110,450 Ì (1,409) 109,041
Equity instruments and equity method
investments ÏÏÏÏÏÏÏÏÏÏÏÏÏÏÏÏÏÏÏÏÏÏÏÏÏÏÏÏ 51,949 Ì Ì 51,949
$828,882 $115 $(3,330) $825,667
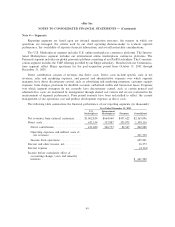
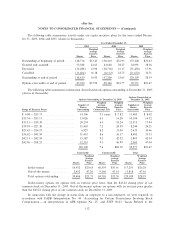
The following table summarizes the fair value and gross unrealized losses of our short-term and long-term
investments, aggregated by type of investment instrument and length of time that individual securities have
been in a continuous unrealized loss position, at December 31, 2005 (in thousands):
Less than 12 Months 12 Months or Greater Total
Gross Gross Gross
Unrealized Unrealized Unrealized
Fair Value Losses Fair Value Losses Fair Value Losses
Corporate debt
securitiesÏÏÏÏÏÏÏÏÏÏ $401,789 $(1,544) $250,487 $(3,011) $ 652,276 $(4,555)
Government and
agency securities ÏÏÏ 47,184 (38) 398,486 (4,624) 445,670 (4,662)
$448,973 $(1,582) $648,973 $(7,635) $1,097,946 $(9,217)
Our investment portfolio consists of both corporate and government securities that have a maximum
maturity of three years. The longer the duration of these securities, the more susceptible they are to changes in
market interest rates and bond yields. As yields increase, those securities purchased with a lower yield-at-cost
show a mark-to-market unrealized loss. All unrealized losses are due to changes in interest rates and bond
yields. We expect to realize the full value of all these investments upon maturity or sale. The losses on these
securities have an average duration of approximately 11 months.
102