eBay 2005 Annual Report Download - page 51
Download and view the complete annual report
Please find page 51 of the 2005 eBay annual report below. You can navigate through the pages in the report by either clicking on the pages listed below, or by using the keyword search tool below to find specific information within the annual report.-
 1
1 -
2
-
3
-
4
-
5
-
6
-
7
-
8
-
9
-
10
-
11
-
12
-
13
-
14
-
15
-
16
-
17
-
18
-
19
-
20
-
21
-
22
-
23
-
24
-
25
-
26
-
27
-
28
-
29
-
30
-
31
-
32
-
33
-
34
-
35
-
36
-
37
-
38
-
39
-
40
-
 41
41 -
 42
42 -
 43
43 -
 44
44 -
 45
45 -
 46
46 -
 47
47 -
 48
48 -
 49
49 -
 50
50 -
 51
51 -
 52
52 -
 53
53 -
 54
54 -
 55
55 -
 56
56 -
 57
57 -
 58
58 -
 59
59 -
 60
60 -
 61
61 -
62
-
63
-
64
-
65
-
66
-
67
-
68
-
69
-
70
-
71
-
72
-
73
-
74
-
75
-
76
-
77
-
78
-
79
-
80
-
81
-
82
-
83
-
84
-
85
-
86
-
87
-
88
-
89
-
90
-
91
-
92
-
93
-
94
-
95
-
96
-
97
-
98
-
99
-
100
-
101
-
102
-
103
-
104
-
105
-
106
-
107
-
108
-
109
-
110
-
111
-
112
-
113
-
114
-
115
-
116
-
117
-
118
-
119
-
120
-
121
-
122
-
123
 |
 |

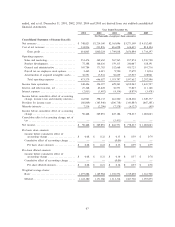
ended, and as of, December 31, 2001, 2002, 2003, 2004 and 2005 are derived from our audited consolidated
financial statements.
Year Ended December 31,
2001 2002 2003 2004 2005
(In thousands, except per share amounts)
Consolidated Statement of Income Data(1):
Net revenuesÏÏÏÏÏÏÏÏÏÏÏÏÏÏÏÏÏÏÏÏÏÏÏÏÏÏÏÏÏÏ $ 748,821 $1,214,100 $2,165,096 $3,271,309 $ 4,552,401
Cost of net revenues ÏÏÏÏÏÏÏÏÏÏÏÏÏÏÏÏÏÏÏÏÏÏÏ 134,816 213,876 416,058 614,415 818,104
Gross profit ÏÏÏÏÏÏÏÏÏÏÏÏÏÏÏÏÏÏÏÏÏÏÏÏÏÏÏ 614,005 1,000,224 1,749,038 2,656,894 3,734,297
Operating expenses:
Sales and marketingÏÏÏÏÏÏÏÏÏÏÏÏÏÏÏÏÏÏÏÏÏÏ 253,474 349,650 567,565 857,874 1,230,728
Product development ÏÏÏÏÏÏÏÏÏÏÏÏÏÏÏÏÏÏÏÏÏ 75,288 104,636 159,315 240,647 328,191
General and administrative ÏÏÏÏÏÏÏÏÏÏÏÏÏÏÏÏ 105,784 171,785 332,668 415,725 591,716
Payroll tax on employee stock optionsÏÏÏÏÏÏÏ 2,442 4,015 9,590 17,479 13,014
Amortization of acquired intangible assets ÏÏÏ 36,591 15,941 50,659 65,927 128,941
Total operating expenses ÏÏÏÏÏÏÏÏÏÏÏÏÏÏÏÏ 473,579 646,027 1,119,797 1,597,652 2,292,590
Income from operationsÏÏÏÏÏÏÏÏÏÏÏÏÏÏÏÏÏÏÏÏÏ 140,426 354,197 629,241 1,059,242 1,441,707
Interest and other income, net ÏÏÏÏÏÏÏÏÏÏÏÏÏÏÏ 25,368 45,428 36,573 77,867 111,148
Interest expense ÏÏÏÏÏÏÏÏÏÏÏÏÏÏÏÏÏÏÏÏÏÏÏÏÏÏÏ (2,851) (1,492) (4,314) (8,879) (3,478)
Income before cumulative effect of accounting
change, income taxes and minority interestsÏÏ 162,943 398,133 661,500 1,128,230 1,549,377
Provision for income taxes ÏÏÏÏÏÏÏÏÏÏÏÏÏÏÏÏÏÏ (80,009) (145,946) (206,738) (343,885) (467,285)
Minority interests ÏÏÏÏÏÏÏÏÏÏÏÏÏÏÏÏÏÏÏÏÏÏÏÏÏÏ 7,514 (2,296) (7,578) (6,122) (49)
Income before cumulative effect of accounting
change ÏÏÏÏÏÏÏÏÏÏÏÏÏÏÏÏÏÏÏÏÏÏÏÏÏÏÏÏÏÏÏÏÏ 90,448 249,891 447,184 778,223 1,082,043
Cumulative effect of accounting change, net of
tax ÏÏÏÏÏÏÏÏÏÏÏÏÏÏÏÏÏÏÏÏÏÏÏÏÏÏÏÏÏÏÏÏÏÏÏÏ Ì Ì (5,413) Ì Ì
Net income ÏÏÏÏÏÏÏÏÏÏÏÏÏÏÏÏÏÏÏÏÏÏÏÏÏÏÏÏÏÏÏ $ 90,448 $ 249,891 $ 441,771 $ 778,223 $ 1,082,043
Per basic share amounts:
Income before cumulative effect of
accounting change ÏÏÏÏÏÏÏÏÏÏÏÏÏÏÏÏÏÏÏÏÏ $ 0.08 $ 0.22 $ 0.35 $ 0.59 $ 0.79
Cumulative effect of accounting change ÏÏÏÏÏ Ì Ì (0.00) Ì Ì
Per basic share amounts ÏÏÏÏÏÏÏÏÏÏÏÏÏÏÏÏ $ 0.08 $ 0.22 $ 0.35 $ 0.59 $ 0.79
Per share diluted amounts:
Income before cumulative effect of
accounting change ÏÏÏÏÏÏÏÏÏÏÏÏÏÏÏÏÏÏÏÏÏ $ 0.08 $ 0.21 $ 0.34 $ 0.57 $ 0.78
Cumulative effect of accounting change ÏÏÏÏÏ Ì Ì (0.00) Ì Ì
Per share diluted amountsÏÏÏÏÏÏÏÏÏÏÏÏÏÏÏ $ 0.08 $ 0.21 $ 0.34 $ 0.57 $ 0.78
Weighted average shares:
Basic ÏÏÏÏÏÏÏÏÏÏÏÏÏÏÏÏÏÏÏÏÏÏÏÏÏÏÏÏÏÏÏÏÏÏ 1,075,884 1,149,984 1,276,576 1,319,458 1,361,708
DilutedÏÏÏÏÏÏÏÏÏÏÏÏÏÏÏÏÏÏÏÏÏÏÏÏÏÏÏÏÏÏÏÏÏ 1,122,380 1,171,280 1,313,314 1,367,720 1,393,875
47