eBay 2005 Annual Report Download - page 120
Download and view the complete annual report
Please find page 120 of the 2005 eBay annual report below. You can navigate through the pages in the report by either clicking on the pages listed below, or by using the keyword search tool below to find specific information within the annual report.-
 1
1 -
2
-
3
-
4
-
5
-
6
-
7
-
8
-
9
-
10
-
11
-
12
-
13
-
14
-
15
-
16
-
17
-
18
-
19
-
20
-
21
-
22
-
23
-
24
-
25
-
26
-
27
-
28
-
29
-
30
-
31
-
32
-
33
-
34
-
35
-
36
-
37
-
38
-
39
-
40
-
41
-
42
-
43
-
44
-
45
-
46
-
47
-
48
-
49
-
50
-
51
-
52
-
53
-
54
-
55
-
56
-
57
-
58
-
59
-
60
-
61
-
62
-
63
-
64
-
65
-
66
-
67
-
68
-
69
-
70
-
71
-
72
-
73
-
74
-
75
-
76
-
77
-
78
-
79
-
80
-
81
-
82
-
83
-
84
-
85
-
86
-
87
-
88
-
89
-
90
-
91
-
92
-
93
-
94
-
95
-
96
-
97
-
98
-
99
-
100
-
101
-
102
-
103
-
104
-
105
-
106
-
107
-
108
-
109
-
 110
110 -
 111
111 -
 112
112 -
 113
113 -
 114
114 -
 115
115 -
 116
116 -
 117
117 -
 118
118 -
 119
119 -
 120
120 -
 121
121 -
 122
122 -
 123
123
 |
 |

eBay Inc.
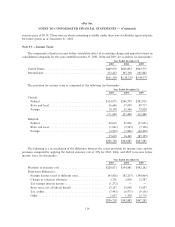
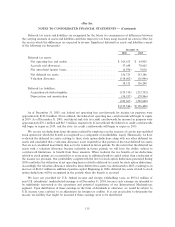
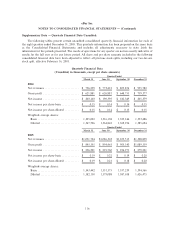
NOTES TO CONSOLIDATED FINANCIAL STATEMENTS Ì (Continued)
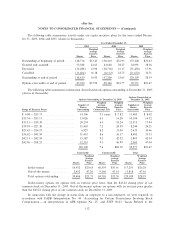
Supplementary Data Ì Quarterly Financial Data-Unaudited:
The following tables present certain unaudited consolidated quarterly financial information for each of
the eight quarters ended December 31, 2005. This quarterly information has been prepared on the same basis
as the Consolidated Financial Statements and includes all adjustments necessary to state fairly the
information for the periods presented. The results of operations for any quarter are not necessarily indicative of
results for the full year or for any future period. All share and per share amounts included in the following
consolidated financial data have been adjusted to reflect all previous stock splits, including our two-for-one
stock split, effective February 16, 2005.
Quarterly Financial Data
(Unaudited, in thousands, except per share amounts)
Quarter Ended
March 31 June 30 September 30 December 31
2004
Net revenues ÏÏÏÏÏÏÏÏÏÏÏÏÏÏÏÏÏÏÏÏÏÏÏÏ $ 756,239 $ 773,412 $ 805,876 $ 935,782
Gross profit ÏÏÏÏÏÏÏÏÏÏÏÏÏÏÏÏÏÏÏÏÏÏÏÏÏ $ 621,881 $ 626,881 $ 648,755 $ 759,377
Net income ÏÏÏÏÏÏÏÏÏÏÏÏÏÏÏÏÏÏÏÏÏÏÏÏÏ $ 200,100 $ 190,395 $ 182,349 $ 205,379
Net income per share-basic ÏÏÏÏÏÏÏÏÏÏÏÏ $ 0.15 $ 0.14 $ 0.14 $ 0.15
Net income per share-diluted ÏÏÏÏÏÏÏÏÏÏ $ 0.15 $ 0.14 $ 0.13 $ 0.15
Weighted-average shares:
Basic ÏÏÏÏÏÏÏÏÏÏÏÏÏÏÏÏÏÏÏÏÏÏÏÏÏÏÏÏÏ 1,305,002 1,316,138 1,323,144 1,333,486
Diluted ÏÏÏÏÏÏÏÏÏÏÏÏÏÏÏÏÏÏÏÏÏÏÏÏÏÏÏ 1,347,596 1,364,842 1,369,954 1,385,694
Quarter Ended
March 31 June 30 September 30 December 31
2005
Net revenues ÏÏÏÏÏÏÏÏÏÏÏÏÏÏÏÏÏÏÏÏÏÏÏÏ $1,031,724 $1,086,303 $1,105,515 $1,328,859
Gross profit ÏÏÏÏÏÏÏÏÏÏÏÏÏÏÏÏÏÏÏÏÏÏÏÏÏ $ 845,355 $ 894,463 $ 905,140 $1,089,339
Net income ÏÏÏÏÏÏÏÏÏÏÏÏÏÏÏÏÏÏÏÏÏÏÏÏÏ $ 256,291 $ 291,560 $ 254,971 $ 279,221
Net income per share-basic ÏÏÏÏÏÏÏÏÏÏÏÏ $ 0.19 $ 0.22 $ 0.19 $ 0.20
Net income per share-diluted ÏÏÏÏÏÏÏÏÏÏ $ 0.19 $ 0.21 $ 0.18 $ 0.20
Weighted-average shares:
Basic ÏÏÏÏÏÏÏÏÏÏÏÏÏÏÏÏÏÏÏÏÏÏÏÏÏÏÏÏÏ 1,343,442 1,351,375 1,357,239 1,394,566
Diluted ÏÏÏÏÏÏÏÏÏÏÏÏÏÏÏÏÏÏÏÏÏÏÏÏÏÏÏ 1,382,150 1,379,088 1,387,038 1,426,475
116