eBay 2005 Annual Report Download - page 63
Download and view the complete annual report
Please find page 63 of the 2005 eBay annual report below. You can navigate through the pages in the report by either clicking on the pages listed below, or by using the keyword search tool below to find specific information within the annual report.-
 1
1 -
2
-
3
-
4
-
5
-
6
-
7
-
8
-
9
-
10
-
11
-
12
-
13
-
14
-
15
-
16
-
17
-
18
-
19
-
20
-
21
-
22
-
23
-
24
-
25
-
26
-
27
-
28
-
29
-
30
-
31
-
32
-
33
-
34
-
35
-
36
-
37
-
38
-
39
-
40
-
41
-
42
-
43
-
44
-
45
-
46
-
47
-
48
-
49
-
50
-
51
-
52
-
 53
53 -
 54
54 -
 55
55 -
 56
56 -
 57
57 -
 58
58 -
 59
59 -
 60
60 -
 61
61 -
 62
62 -
 63
63 -
 64
64 -
 65
65 -
 66
66 -
 67
67 -
 68
68 -
 69
69 -
 70
70 -
 71
71 -
 72
72 -
 73
73 -
74
-
75
-
76
-
77
-
78
-
79
-
80
-
81
-
82
-
83
-
84
-
85
-
86
-
87
-
88
-
89
-
90
-
91
-
92
-
93
-
94
-
95
-
96
-
97
-
98
-
99
-
100
-
101
-
102
-
103
-
104
-
105
-
106
-
107
-
108
-
109
-
110
-
111
-
112
-
113
-
114
-
115
-
116
-
117
-
118
-
119
-
120
-
121
-
122
-
123
 |
 |

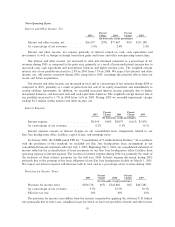
Non-Operating Items
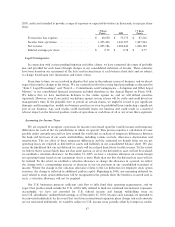
Interest and Other Income, Net
Percent Percent
2003 Change 2004 Change 2005
(In thousands, except percentages)
Interest and other income, net ÏÏÏÏÏÏÏÏÏÏÏÏ $36,573 129% $77,867 43% $111,148
As a percentage of net revenuesÏÏÏÏÏÏÏÏÏÏÏ 1.6% 2.4% 2.4%
Interest and other income, net consists primarily of interest earned on cash, cash equivalents and
investments as well as foreign exchange transaction gains and losses and other non-operating transactions.
Our interest and other income, net increased in total and remained consistent as a percentage of net
revenues during 2005 as compared to the prior year, primarily as a result of increased interest income due to
increased cash, cash equivalents and investments balances and higher interest rates. The weighted-average
interest rate of our portfolio increased to 2.9% in 2005 from 1.7% in 2004. We expect that interest and other
income, net, will remain consistent during 2006 compared to 2005, excluding the potential effects from our
recent and future acquisitions.
Our interest and other income, net increased in total and as a percentage of net revenues during 2004 as
compared to 2003, primarily as a result of gains from the sale of an equity investment and amendments to
certain sublease agreements. In addition, we recorded increased interest income primarily due to higher
investment balances, and increased cash and cash equivalents balances. The weighted-average interest rate of
our portfolio increased to 1.7% in 2004 from 1.6% in 2003. During 2003 we recorded impairment charges
totaling $1.2 million within interest and other income, net.
Interest Expense
Percent Percent
2003 Change 2004 Change 2005
(In thousands, except percentages)
Interest expense ÏÏÏÏÏÏÏÏÏÏÏÏÏÏÏÏÏÏÏÏÏÏÏÏÏÏÏÏ $4,314 106% $8,879 (61)% $3,478
As a percentage of net revenuesÏÏÏÏÏÏÏÏÏÏÏÏÏÏÏ 0.2% 0.3% 0.1%
Interest expense consists of interest charges on our consolidated lease arrangement related to our
San Jose headquarters office facilities, capital leases, and mortgage notes.
In January 2003, the FASB issued FIN 46, ""Consolidation of Variable Interest Entities.'' In accordance
with the provisions of this standard, we included our San Jose headquarters lease arrangement in our
consolidated financial statements effective July 1, 2003. Beginning July 1, 2003, our consolidated statement of
income reflected the reclassification of lease payments on our San Jose headquarters office facilities from
operating expense to interest expense. The increase in interest expense during 2004 was primarily the result of
the inclusion of these interest payments for the full year 2004. Interest expense decreased during 2005
primarily due to the payment of the lease obligation of our San Jose headquarters facility on March 1, 2005.
We expect our interest expense will decrease both in total and as a percentage of net revenue during 2006.
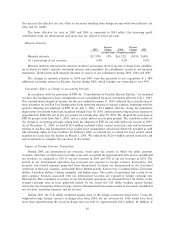
Provision for Income Taxes
Percent Percent
2003 Change 2004 Change 2005
(In thousands, except percentages)
Provision for income taxes ÏÏÏÏÏÏÏÏÏÏÏÏÏ $206,738 66% $343,885 36% $467,285
As a percentage of net revenuesÏÏÏÏÏÏÏÏÏ 9.5% 10.5% 10.3%
Effective tax rate ÏÏÏÏÏÏÏÏÏÏÏÏÏÏÏÏÏÏÏÏÏ 32% 30% 30%
The provision for income taxes differs from the amount computed by applying the statutory U.S. federal
rate principally due to state taxes, subsidiary losses for which we have not provided a benefit and other factors
59