UPS 2008 Annual Report Download - page 98
Download and view the complete annual report
Please find page 98 of the 2008 UPS annual report below. You can navigate through the pages in the report by either clicking on the pages listed below, or by using the keyword search tool below to find specific information within the annual report.-
 1
1 -
2
-
3
-
4
-
5
-
6
-
7
-
8
-
9
-
10
-
11
-
12
-
13
-
14
-
15
-
16
-
17
-
18
-
19
-
20
-
21
-
22
-
23
-
24
-
25
-
26
-
27
-
28
-
29
-
30
-
31
-
32
-
33
-
34
-
35
-
36
-
37
-
38
-
39
-
40
-
41
-
42
-
43
-
44
-
45
-
46
-
47
-
48
-
49
-
50
-
51
-
52
-
53
-
54
-
55
-
56
-
57
-
58
-
59
-
60
-
61
-
62
-
63
-
64
-
65
-
66
-
67
-
68
-
69
-
70
-
71
-
72
-
73
-
74
-
75
-
76
-
77
-
78
-
79
-
80
-
81
-
82
-
83
-
84
-
85
-
86
-
87
-
 88
88 -
 89
89 -
 90
90 -
 91
91 -
 92
92 -
 93
93 -
 94
94 -
 95
95 -
 96
96 -
 97
97 -
 98
98 -
 99
99 -
 100
100 -
 101
101 -
 102
102 -
 103
103 -
 104
104 -
 105
105 -
 106
106 -
 107
107 -
 108
108 -
109
-
110
-
111
-
112
-
113
-
114
-
115
-
116
-
117
-
118
-
119
-
120
 |
 |

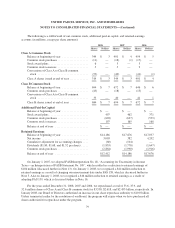
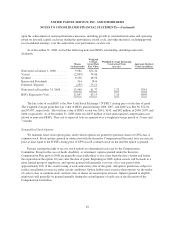
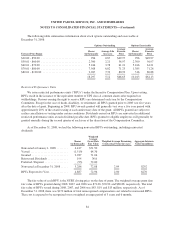
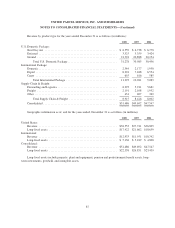
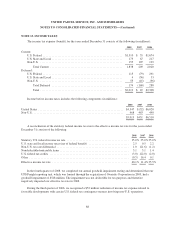
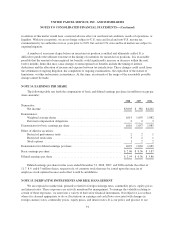
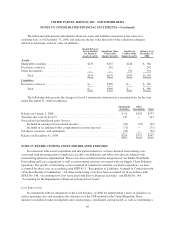
UNITED PARCEL SERVICE, INC. AND SUBSIDIARIES
NOTES TO CONSOLIDATED FINANCIAL STATEMENTS—(Continued)
Revenue by product type for the years ended December 31 is as follows (in millions):
2008 2007 2006
U.S. Domestic Package:
Next Day Air .................................................. $ 6,559 $ 6,738 $ 6,778
Deferred ...................................................... 3,325 3,359 3,424
Ground ....................................................... 21,394 20,888 20,254
Total U.S. Domestic Package .................................. 31,278 30,985 30,456
International Package:
Domestic ...................................................... 2,344 2,177 1,950
Export ........................................................ 8,294 7,488 6,554
Cargo ........................................................ 655 616 585
Total International Package ................................... 11,293 10,281 9,089
Supply Chain & Freight:
Forwarding and Logistics ......................................... 6,293 5,911 5,681
Freight ....................................................... 2,191 2,108 1,952
Other ......................................................... 431 407 369
Total Supply Chain & Freight ................................. 8,915 8,426 8,002
Consolidated ................................................... $51,486 $49,692 $47,547
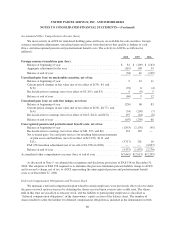
Geographic information as of, and for the years ended, December 31 is as follows (in millions):
2008 2007 2006
United States:
Revenue ...................................................... $38,553 $37,741 $36,805
Long-lived assets ............................................... $17,422 $21,662 $18,659
International:
Revenue ...................................................... $12,933 $11,951 $10,742
Long-lived assets ............................................... $ 5,136 $ 5,189 $ 4,800
Consolidated:
Revenue ...................................................... $51,486 $49,692 $47,547
Long-lived assets ............................................... $22,558 $26,851 $23,459
Long-lived assets include property, plant and equipment, pension and postretirement benefit assets, long-
term investments, goodwill, and intangible assets.
87