UPS 2008 Annual Report Download - page 76
Download and view the complete annual report
Please find page 76 of the 2008 UPS annual report below. You can navigate through the pages in the report by either clicking on the pages listed below, or by using the keyword search tool below to find specific information within the annual report.-
 1
1 -
2
-
3
-
4
-
5
-
6
-
7
-
8
-
9
-
10
-
11
-
12
-
13
-
14
-
15
-
16
-
17
-
18
-
19
-
20
-
21
-
22
-
23
-
24
-
25
-
26
-
27
-
28
-
29
-
30
-
31
-
32
-
33
-
34
-
35
-
36
-
37
-
38
-
39
-
40
-
41
-
42
-
43
-
44
-
45
-
46
-
47
-
48
-
49
-
50
-
51
-
52
-
53
-
54
-
55
-
56
-
57
-
58
-
59
-
60
-
61
-
62
-
63
-
64
-
65
-
 66
66 -
 67
67 -
 68
68 -
 69
69 -
 70
70 -
 71
71 -
 72
72 -
 73
73 -
 74
74 -
 75
75 -
 76
76 -
 77
77 -
 78
78 -
 79
79 -
 80
80 -
 81
81 -
 82
82 -
 83
83 -
 84
84 -
 85
85 -
 86
86 -
87
-
88
-
89
-
90
-
91
-
92
-
93
-
94
-
95
-
96
-
97
-
98
-
99
-
100
-
101
-
102
-
103
-
104
-
105
-
106
-
107
-
108
-
109
-
110
-
111
-
112
-
113
-
114
-
115
-
116
-
117
-
118
-
119
-
120
 |
 |

UNITED PARCEL SERVICE, INC. AND SUBSIDIARIES
NOTES TO CONSOLIDATED FINANCIAL STATEMENTS—(Continued)
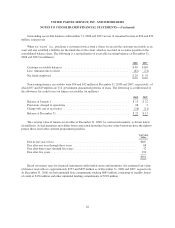
consisting of actuarial gains and losses and prior service costs and credits, to be recognized in other
comprehensive income and subsequently amortized to the income statement. On December 31, 2006, we adopted
the recognition and disclosure provisions of FAS 158, which resulted in a reduction to AOCI of $2.097 billion
and a reduction of long-term deferred tax liabilities of $1.258 billion.
Additionally, we previously utilized the early measurement date option available under Statement No. 87
“Employers’ Accounting for Pensions”, and we measured the funded status of our plans as of September 30 each
year. Under the provisions of FAS 158, we were required to use a December 31 measurement date for all of our
pension and postretirement benefit plans beginning in 2008. As a result of this change in measurement date, we
recorded a cumulative effect after-tax $44 million reduction to retained earnings as of January 1, 2008.
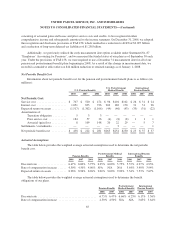
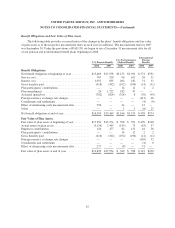
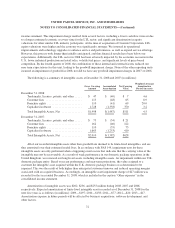
Net Periodic Benefit Cost
Information about net periodic benefit cost for the pension and postretirement benefit plans is as follows (in
millions):
U.S. Pension Benefits
U.S. Postretirement
Medical Benefits
International
Pension Benefits
2008 2007 2006 2008 2007 2006 2008 2007 2006
Net Periodic Cost:
Service cost .................... $ 707 $ 520 $ 474 $ 96 $101 $102 $ 26 $ 31 $ 24
Interest cost .................... 1,051 835 726 202 182 170 31 31 26
Expected return on assets .......... (1,517) (1,302) (1,106) (49) (46) (43) (35) (31) (22)
Amortization of:
Transition obligation .........533——————
Prior service cost ............ 184 57 36 (4) (8) (8) 1 1 1
Actuarial (gain) loss .......... 8 109 148 20 22 29 — 5 7
Settlements / curtailments ......... — — — — 3 — — — 1
Net periodic benefit cost .......... $ 438 $ 222 $ 281 $265 $254 $250 $ 23 $ 37 $ 37
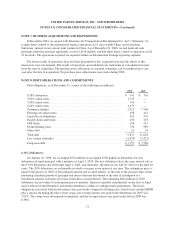
Actuarial Assumptions
The table below provides the weighted average actuarial assumptions used to determine the net periodic
benefit cost.
Pension Benefits
Postretirement Medical
Benefits
International Pension
Benefits
2008 2007 2006 2008 2007 2006 2008 2007 2006
Discount rate .................... 6.47% 6.00% 5.75% 6.25% 6.00% 5.75% 5.57% 4.97% 4.93%
Rate of compensation increase ...... 4.50% 4.50% 4.00% N/A N/A N/A 3.64% 3.40% 3.94%
Expected return on assets .......... 8.96% 8.96% 8.96% 9.00% 9.00% 9.00% 7.54% 7.53% 7.67%
The table below provides the weighted average actuarial assumptions used to determine the benefit
obligations of our plans.
Pension Benefits
Postretirement
Medical Benefits
International
Pension Benefits
2008 2007 2008 2007 2008 2007
Discount rate ........................................ 6.75% 6.47% 6.66% 6.25% 6.17% 5.56%
Rate of compensation increase .......................... 4.50% 4.50% N/A N/A 3.65% 3.64%
65