UPS 2008 Annual Report Download - page 33
Download and view the complete annual report
Please find page 33 of the 2008 UPS annual report below. You can navigate through the pages in the report by either clicking on the pages listed below, or by using the keyword search tool below to find specific information within the annual report.-
 1
1 -
2
-
3
-
4
-
5
-
6
-
7
-
8
-
9
-
10
-
11
-
12
-
13
-
14
-
15
-
16
-
17
-
18
-
19
-
20
-
21
-
22
-
 23
23 -
 24
24 -
 25
25 -
 26
26 -
 27
27 -
 28
28 -
 29
29 -
 30
30 -
 31
31 -
 32
32 -
 33
33 -
 34
34 -
 35
35 -
 36
36 -
 37
37 -
 38
38 -
 39
39 -
 40
40 -
 41
41 -
 42
42 -
 43
43 -
44
-
45
-
46
-
47
-
48
-
49
-
50
-
51
-
52
-
53
-
54
-
55
-
56
-
57
-
58
-
59
-
60
-
61
-
62
-
63
-
64
-
65
-
66
-
67
-
68
-
69
-
70
-
71
-
72
-
73
-
74
-
75
-
76
-
77
-
78
-
79
-
80
-
81
-
82
-
83
-
84
-
85
-
86
-
87
-
88
-
89
-
90
-
91
-
92
-
93
-
94
-
95
-
96
-
97
-
98
-
99
-
100
-
101
-
102
-
103
-
104
-
105
-
106
-
107
-
108
-
109
-
110
-
111
-
112
-
113
-
114
-
115
-
116
-
117
-
118
-
119
-
120
 |
 |

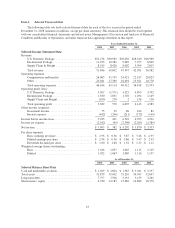
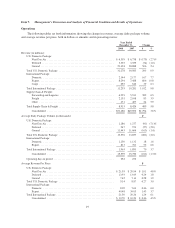
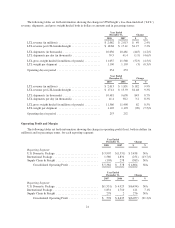
The following table sets forth information showing the operating margin for each reporting segment:
Year Ended December 31,
2008 2007 2006
Reporting Segment
U.S. Domestic Package .......................................... 12.5% (4.9)% 16.2%
International Package ............................................ 14.0% 17.8% 18.8%
Supply Chain & Freight .......................................... (1.2)% 3.3% 0.0%
Consolidated Operating Margin ................................ 10.5% 1.2% 14.0%
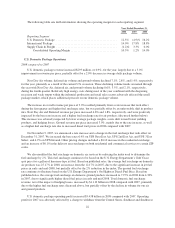
U.S. Domestic Package Operations
2008 compared to 2007
U.S. domestic package revenue increased $293 million, or 0.9%, for the year, largely due to a 3.0%
improvement in revenue per piece, partially offset by a 2.0% decrease in average daily package volume.
Next Day Air volume, deferred air volume and ground volume declined 7.1%, 2.8%, and 1.4%, respectively
for the year, primarily as a result of the current U.S. recession. These declining volume trends worsened through
the year with Next Day Air, deferred air, and ground volume declining 8.6%, 3.5%, and 2.1%, respectively,
during the fourth quarter. Relatively high energy costs during most of the year combined with the deepening
recession and weak output within the industrial production and retail sales sectors adversely affected the small
package market, which places additional pressure on our domestic package volume.
The increase in overall revenue per piece of 3.0% resulted primarily from a rate increase that took effect
during the first quarter and higher fuel surcharge rates, but was partially offset by an unfavorable shift in product
mix. Next Day Air and Deferred revenue per piece increased 4.8% and 1.8%, respectively, and were positively
impacted by the base rate increase and a higher fuel surcharge rate for air products (discussed further below).
This increase was adversely impacted by lower average package weights, a mix shift toward lower yielding
products, and hedging losses. Ground revenue per piece increased 3.9%, mainly due to the rate increase, as well
as a higher fuel surcharge rate due to increased diesel fuel prices in 2008 compared with 2007.
On November 9, 2007, we announced a rate increase and a change in the fuel surcharge that took effect on
December 31, 2007. We increased the base rates 6.9% on UPS Next Day Air, UPS 2nd Day Air, and UPS 3 Day
Select, and 4.9% on UPS Ground. Other pricing changes included a $0.10 increase in the residential surcharge,
and an increase of $0.10 in the delivery area surcharge on both residential and commercial services to certain ZIP
codes.
We also modified the fuel surcharge on domestic air services by reducing the index used to determine the
fuel surcharge by 2%. This fuel surcharge continues to be based on the U.S. Energy Department’s Gulf Coast
spot price for a gallon of kerosene-type jet fuel. Based on published rates, the average fuel surcharge on domestic
air products was 25.17% in 2008, an increase from the 12.17% in 2007, due to the significant increase in jet fuel
prices in early and mid-2008, but partially offset by the 2% reduction in the index. The ground fuel surcharge
rate continues to fluctuate based on the U.S. Energy Department’s On-Highway Diesel Fuel Price. Based on
published rates, the average fuel surcharge on domestic ground products increased to 7.97% in 2008 from 4.30%
in 2007, due to significantly higher diesel fuel prices in early and mid-2008. Total domestic fuel surcharge
revenue, net of the impact of hedging losses, increased by $1.119 billion in 2008 compared with 2007, primarily
due to the higher fuel surcharge rates discussed above, but partially offset by the decline in volume for our air
and ground products.
U.S. domestic package operating profit increased $5.438 billion in 2008 compared with 2007. Operating
profit for 2007 was adversely affected by a charge to withdraw from the Central States, Southeast and Southwest
22