UPS 2008 Annual Report Download - page 73
Download and view the complete annual report
Please find page 73 of the 2008 UPS annual report below. You can navigate through the pages in the report by either clicking on the pages listed below, or by using the keyword search tool below to find specific information within the annual report.-
 1
1 -
2
-
3
-
4
-
5
-
6
-
7
-
8
-
9
-
10
-
11
-
12
-
13
-
14
-
15
-
16
-
17
-
18
-
19
-
20
-
21
-
22
-
23
-
24
-
25
-
26
-
27
-
28
-
29
-
30
-
31
-
32
-
33
-
34
-
35
-
36
-
37
-
38
-
39
-
40
-
41
-
42
-
43
-
44
-
45
-
46
-
47
-
48
-
49
-
50
-
51
-
52
-
53
-
54
-
55
-
56
-
57
-
58
-
59
-
60
-
61
-
62
-
 63
63 -
 64
64 -
 65
65 -
 66
66 -
 67
67 -
 68
68 -
 69
69 -
 70
70 -
 71
71 -
 72
72 -
 73
73 -
 74
74 -
 75
75 -
 76
76 -
 77
77 -
 78
78 -
 79
79 -
 80
80 -
 81
81 -
 82
82 -
 83
83 -
84
-
85
-
86
-
87
-
88
-
89
-
90
-
91
-
92
-
93
-
94
-
95
-
96
-
97
-
98
-
99
-
100
-
101
-
102
-
103
-
104
-
105
-
106
-
107
-
108
-
109
-
110
-
111
-
112
-
113
-
114
-
115
-
116
-
117
-
118
-
119
-
120
 |
 |

UNITED PARCEL SERVICE, INC. AND SUBSIDIARIES
NOTES TO CONSOLIDATED FINANCIAL STATEMENTS—(Continued)
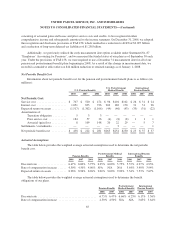
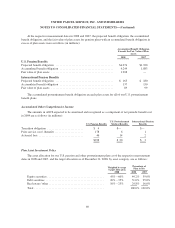
Outstanding receivable balances at December 31, 2008 and 2007 are net of unearned income of $26 and $30
million, respectively.
When we “factor” (i.e., purchase) a customer invoice from a client, we record the customer receivable as an
asset and also establish a liability for the funds due to the client, which is recorded in accounts payable on the
consolidated balance sheet. The following is a reconciliation of receivable factoring balances at December 31,
2008 and 2007 (in millions):
2008 2007
Customer receivable balances ............................................. $90 $109
Less: Amounts due to client ............................................... (62) (74)
Net funds employed ..................................................... $28 $ 35
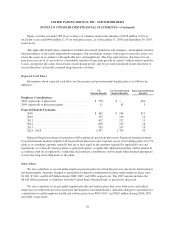
Non-earning finance receivables were $94 and $42 million at December 31, 2008 and 2007, respectively, of
which $57 and $19 million are U.S. government guaranteed portions of loans. The following is a rollforward of
the allowance for credit losses on finance receivables (in millions):
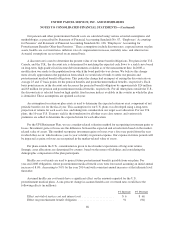
2008 2007
Balance at January 1 ..................................................... $13 $22
Provisions charged to operations ........................................... 28 2
Charge-offs, net of recoveries ............................................. (16) (11)
Balance at December 31 .................................................. $25 $13
The carrying value of finance receivables at December 31, 2008, by contractual maturity, is shown below
(in millions). Actual maturities may differ from contractual maturities because some borrowers have the right to
prepay these receivables without prepayment penalties.
Carrying
Value
Due in one year or less ....................................................... $487
Due after one year through three years ........................................... 68
Due after three years through five years .......................................... 32
Due after five years .......................................................... 394
$981
Based on interest rates for financial instruments with similar terms and maturities, the estimated fair value
of finance receivables is approximately $957 and $895 million as of December 31, 2008 and 2007, respectively.
At December 31, 2008, we had unfunded loan commitments totaling $885 million, consisting of standby letters
of credit of $136 million and other unfunded lending commitments of $749 million.
62