UPS 2008 Annual Report Download - page 31
Download and view the complete annual report
Please find page 31 of the 2008 UPS annual report below. You can navigate through the pages in the report by either clicking on the pages listed below, or by using the keyword search tool below to find specific information within the annual report.-
 1
1 -
2
-
3
-
4
-
5
-
6
-
7
-
8
-
9
-
10
-
11
-
12
-
13
-
14
-
15
-
16
-
17
-
18
-
19
-
20
-
 21
21 -
 22
22 -
 23
23 -
 24
24 -
 25
25 -
 26
26 -
 27
27 -
 28
28 -
 29
29 -
 30
30 -
 31
31 -
 32
32 -
 33
33 -
 34
34 -
 35
35 -
 36
36 -
 37
37 -
 38
38 -
 39
39 -
 40
40 -
 41
41 -
42
-
43
-
44
-
45
-
46
-
47
-
48
-
49
-
50
-
51
-
52
-
53
-
54
-
55
-
56
-
57
-
58
-
59
-
60
-
61
-
62
-
63
-
64
-
65
-
66
-
67
-
68
-
69
-
70
-
71
-
72
-
73
-
74
-
75
-
76
-
77
-
78
-
79
-
80
-
81
-
82
-
83
-
84
-
85
-
86
-
87
-
88
-
89
-
90
-
91
-
92
-
93
-
94
-
95
-
96
-
97
-
98
-
99
-
100
-
101
-
102
-
103
-
104
-
105
-
106
-
107
-
108
-
109
-
110
-
111
-
112
-
113
-
114
-
115
-
116
-
117
-
118
-
119
-
120
 |
 |

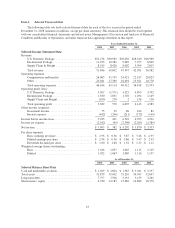
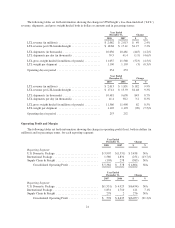
Year Ended
December 31, Change
2007 2006 $ %
Revenue (in millions):
U.S. Domestic Package:
Next Day Air .......................................... $ 6,738 $ 6,778 $ (40) (0.6)%
Deferred .............................................. 3,359 3,424 (65) (1.9)
Ground ............................................... 20,888 20,254 634 3.1
Total U.S. Domestic Package ................................. 30,985 30,456 529 1.7
International Package:
Domestic ............................................. 2,177 1,950 227 11.6
Export ............................................... 7,488 6,554 934 14.3
Cargo ................................................ 616 585 31 5.3
Total International Package ................................... 10,281 9,089 1,192 13.1
Supply Chain & Freight:
Forwarding and Logistics ................................ 5,911 5,681 230 4.0
UPS Freight ........................................... 2,108 1,952 156 8.0
Other ................................................ 407 369 38 10.3
Total Supply Chain & Freight ................................. 8,426 8,002 424 5.3
Consolidated .......................................... $49,692 $47,547 $2,145 4.5%
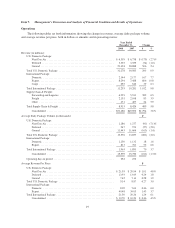
Average Daily Package Volume (in thousands): #
U.S. Domestic Package:
Next Day Air .......................................... 1,277 1,267 10 0.8%
Deferred .............................................. 974 993 (19) (1.9)
Ground ............................................... 11,606 11,537 69 0.6
Total U.S. Domestic Package ................................. 13,857 13,797 60 0.4
International Package:
Domestic ............................................. 1,132 1,108 24 2.2
Export ............................................... 761 689 72 10.4
Total International Package ................................... 1,893 1,797 96 5.3
Consolidated .......................................... 15,750 15,594 156 1.0%
Operating days in period ..................................... 252 253
Average Revenue Per Piece: $
U.S. Domestic Package:
Next Day Air .......................................... $ 20.94 $ 21.14 $ (0.20) (0.9)%
Deferred .............................................. 13.69 13.63 0.06 0.4
Ground ............................................... 7.14 6.94 0.20 2.9
Total U.S. Domestic Package ................................. 8.87 8.73 0.14 1.6
International Package:
Domestic ............................................. 7.63 6.96 0.67 9.6
Export ............................................... 39.05 37.60 1.45 3.9
Total International Package ................................... 20.26 18.70 1.56 8.3
Consolidated .......................................... $ 10.24 $ 9.88 $ 0.36 3.6%
20