UPS 2008 Annual Report Download - page 29
Download and view the complete annual report
Please find page 29 of the 2008 UPS annual report below. You can navigate through the pages in the report by either clicking on the pages listed below, or by using the keyword search tool below to find specific information within the annual report.-
 1
1 -
2
-
3
-
4
-
5
-
6
-
7
-
8
-
9
-
10
-
11
-
12
-
13
-
14
-
15
-
16
-
17
-
18
-
 19
19 -
 20
20 -
 21
21 -
 22
22 -
 23
23 -
 24
24 -
 25
25 -
 26
26 -
 27
27 -
 28
28 -
 29
29 -
 30
30 -
 31
31 -
 32
32 -
 33
33 -
 34
34 -
 35
35 -
 36
36 -
 37
37 -
 38
38 -
 39
39 -
40
-
41
-
42
-
43
-
44
-
45
-
46
-
47
-
48
-
49
-
50
-
51
-
52
-
53
-
54
-
55
-
56
-
57
-
58
-
59
-
60
-
61
-
62
-
63
-
64
-
65
-
66
-
67
-
68
-
69
-
70
-
71
-
72
-
73
-
74
-
75
-
76
-
77
-
78
-
79
-
80
-
81
-
82
-
83
-
84
-
85
-
86
-
87
-
88
-
89
-
90
-
91
-
92
-
93
-
94
-
95
-
96
-
97
-
98
-
99
-
100
-
101
-
102
-
103
-
104
-
105
-
106
-
107
-
108
-
109
-
110
-
111
-
112
-
113
-
114
-
115
-
116
-
117
-
118
-
119
-
120
 |
 |

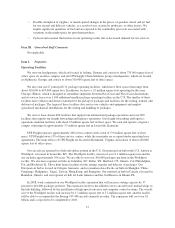
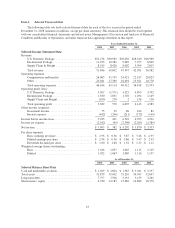
Item 6. Selected Financial Data
The following table sets forth selected financial data for each of the five years in the period ended
December 31, 2008 (amounts in millions, except per share amounts). This financial data should be read together
with our consolidated financial statements and related notes, Management’s Discussion and Analysis of Financial
Condition and Results of Operations, and other financial data appearing elsewhere in this report.
Years Ended December 31,
2008 2007 2006 2005 2004
Selected Income Statement Data
Revenue:
U.S. Domestic Package ......................... $31,278 $30,985 $30,456 $28,610 $26,960
International Package ........................... 11,293 10,281 9,089 7,977 6,809
Supply Chain & Freight ......................... 8,915 8,426 8,002 5,994 2,813
Total revenue ................................. 51,486 49,692 47,547 42,581 36,582
Operating expenses:
Compensation and benefits ...................... 26,063 31,745 24,421 22,517 20,823
Other ........................................ 20,041 17,369 16,491 13,921 10,770
Total operating expenses ........................ 46,104 49,114 40,912 36,438 31,593
Operating profit (loss):
U.S. Domestic Package ......................... 3,907 (1,531) 4,923 4,493 3,702
International Package ........................... 1,580 1,831 1,710 1,494 1,149
Supply Chain and Freight ........................ (105) 278 2 156 138
Total operating profit ........................... 5,382 578 6,635 6,143 4,989
Other income (expense):
Investment income ............................. 75 99 86 104 82
Interest expense ............................... (442) (246) (211) (172) (149)
Income before income taxes .......................... 5,015 431 6,510 6,075 4,922
Income tax expense ................................ (2,012) (49) (2,308) (2,205) (1,589)
Net income ....................................... $ 3,003 $ 382 $ 4,202 $ 3,870 $ 3,333
Per share amounts:
Basic earnings per share ......................... $ 2.96 $ 0.36 $ 3.87 $ 3.48 $ 2.95
Diluted earnings per share ....................... $ 2.94 $ 0.36 $ 3.86 $ 3.47 $ 2.93
Dividends declared per share ..................... $ 1.80 $ 1.68 $ 1.52 $ 1.32 $ 1.12
Weighted average shares outstanding:
Basic ........................................ 1,016 1,057 1,085 1,113 1,129
Diluted ...................................... 1,022 1,063 1,089 1,116 1,137
As of December 31,
2008 2007 2006 2005 2004
Selected Balance Sheet Data
Cash and marketable securities ....................... $ 1,049 $ 2,604 $ 1,983 $ 3,041 $ 5,197
Total assets ....................................... 31,879 39,042 33,210 34,947 32,847
Long-term debt .................................... 7,797 7,506 3,133 3,159 3,261
Shareowners’ equity ................................ 6,780 12,183 15,482 16,884 16,378
18