UPS 2008 Annual Report Download - page 30
Download and view the complete annual report
Please find page 30 of the 2008 UPS annual report below. You can navigate through the pages in the report by either clicking on the pages listed below, or by using the keyword search tool below to find specific information within the annual report.
Item 7. Management’s Discussion and Analysis of Financial Condition and Results of Operations
Operations
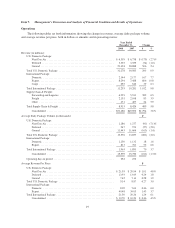
The following tables set forth information showing the change in revenue, average daily package volume,
and average revenue per piece, both in dollars or amounts and in percentage terms:
Year Ended
December 31, Change
2008 2007 $ %
Revenue (in millions):
U.S. Domestic Package:
Next Day Air ................................................... $ 6,559 $ 6,738 $ (179) (2.7)%
Deferred ....................................................... 3,325 3,359 (34) (1.0)
Ground ........................................................ 21,394 20,888 506 2.4
Total U.S. Domestic Package .......................................... 31,278 30,985 293 0.9
International Package:
Domestic ...................................................... 2,344 2,177 167 7.7
Export ......................................................... 8,294 7,488 806 10.8
Cargo ......................................................... 655 616 39 6.3
Total International Package ............................................ 11,293 10,281 1,012 9.8
Supply Chain & Freight:
Forwarding and Logistics ......................................... 6,293 5,911 382 6.5
Freight ........................................................ 2,191 2,108 83 3.9
Other ......................................................... 431 407 24 5.9
Total Supply Chain & Freight .......................................... 8,915 8,426 489 5.8
Consolidated ................................................... $51,486 $49,692 $1,794 3.6%
Average Daily Package Volume (in thousands): #
U.S. Domestic Package:
Next Day Air ................................................... 1,186 1,277 (91) (7.1)%
Deferred ....................................................... 947 974 (27) (2.8)
Ground ........................................................ 11,443 11,606 (163) (1.4)
Total U.S. Domestic Package .......................................... 13,576 13,857 (281) (2.0)
International Package:
Domestic ...................................................... 1,150 1,132 18 1.6
Export ......................................................... 813 761 52 6.8
Total International Package ............................................ 1,963 1,893 70 3.7
Consolidated ................................................... 15,539 15,750 (211) (1.3)%
Operating days in period .............................................. 252 252
Average Revenue Per Piece: $
U.S. Domestic Package:
Next Day Air ................................................... $ 21.95 $ 20.94 $ 1.01 4.8%
Deferred ....................................................... 13.93 13.69 0.24 1.8
Ground ........................................................ 7.42 7.14 0.28 3.9
Total U.S. Domestic Package .......................................... 9.14 8.87 0.27 3.0
International Package:
Domestic ...................................................... 8.09 7.63 0.46 6.0
Export ......................................................... 40.48 39.05 1.43 3.7
Total International Package ............................................ 21.50 20.26 1.24 6.1
Consolidated ................................................... $ 10.70 $ 10.24 $ 0.46 4.5%
19


