UPS 2008 Annual Report Download - page 35
Download and view the complete annual report
Please find page 35 of the 2008 UPS annual report below. You can navigate through the pages in the report by either clicking on the pages listed below, or by using the keyword search tool below to find specific information within the annual report.-
 1
1 -
2
-
3
-
4
-
5
-
6
-
7
-
8
-
9
-
10
-
11
-
12
-
13
-
14
-
15
-
16
-
17
-
18
-
19
-
20
-
21
-
22
-
23
-
24
-
 25
25 -
 26
26 -
 27
27 -
 28
28 -
 29
29 -
 30
30 -
 31
31 -
 32
32 -
 33
33 -
 34
34 -
 35
35 -
 36
36 -
 37
37 -
 38
38 -
 39
39 -
 40
40 -
 41
41 -
 42
42 -
 43
43 -
 44
44 -
 45
45 -
46
-
47
-
48
-
49
-
50
-
51
-
52
-
53
-
54
-
55
-
56
-
57
-
58
-
59
-
60
-
61
-
62
-
63
-
64
-
65
-
66
-
67
-
68
-
69
-
70
-
71
-
72
-
73
-
74
-
75
-
76
-
77
-
78
-
79
-
80
-
81
-
82
-
83
-
84
-
85
-
86
-
87
-
88
-
89
-
90
-
91
-
92
-
93
-
94
-
95
-
96
-
97
-
98
-
99
-
100
-
101
-
102
-
103
-
104
-
105
-
106
-
107
-
108
-
109
-
110
-
111
-
112
-
113
-
114
-
115
-
116
-
117
-
118
-
119
-
120
 |
 |
growth, the aircraft impairment charge, the SVSO charge, and the impact of fuel. The aircraft impairment and
SVSO charges reduced domestic operating profit by $159 million and $53 million, respectively. Fuel negatively
impacted the change in operating profit during 2007, as fuel costs rose much faster than the fuel surcharge rate.
These factors were partially offset by cost controls, including, among other categories, lower self-insurance
expense. The expense associated with our self-insurance accruals for workers’ compensation claims, automotive
liability and general business liabilities declined as a result of several factors. The Central States Pension Fund
withdrawal, aircraft impairment, and SVSO charges, as well as the impact of lower self-insurance expense, are
discussed further in the “Operating Expenses” section.
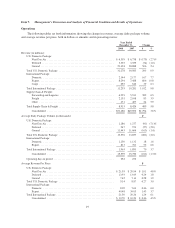
International Package Operations
2008 compared to 2007
International Package revenue improved $1.012 billion, or 9.8%, for the year, driven by a 6.8% volume
increase for our export products and a 6.1% increase in total revenue per piece. The growth in revenue per piece
was primarily due to rate increases, the impact of currency exchange rates, and increased fuel surcharge rates.
However, as the global economic recession deepened throughout the year, fourth quarter revenue trended
downward compared to the prior year fourth quarter, declining $230 million, or 8.0%, including the impact of
unfavorable currency exchange rate fluctuations discussed later.
Export volume increased in each region throughout the world in 2008, however volume began to slow in the
latter half of 2008 due to difficult worldwide economic conditions. Intra-regional volume continued to
experience solid growth, especially in Europe. Asian export volume continued to benefit from our geographic
service expansion, including the connection of several cities to our new air hub in Shanghai, China. Export
volume growth was negatively impacted by declines in shipments to the U.S. from other regions in the world,
due to the slowing U.S. economy. Export volume trends weakened in the latter half of the year, due to the severe
global economic slowdown, with fourth quarter export volume increasing at a much slower rate than what has
been experienced over the last several years. Non-U.S. domestic volume increased 1.6% for the year, and was
impacted by volume growth in our domestic businesses in the Euro zone and Canada, but negatively affected by
the weak economic conditions in the United Kingdom.
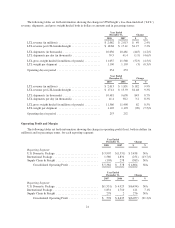
Export revenue per piece increased 3.7% for the year, largely due to base rate increases, higher fuel
surcharge rates, and favorable currency exchange rates, but was adversely impacted by relatively higher growth
in lower revenue per piece transborder products and a shift away from our premium services. Domestic revenue
per piece increased 6.0% for the year, and was affected by rate increases, higher fuel surcharge rates, and
favorable exchange rates. Total average revenue per piece increased 2.7% on a currency-adjusted basis, and the
overall change in segment revenue was positively affected by $324 million during the year due to currency
fluctuations, net of hedging activity. Total revenue per piece declined 8.2% in the fourth quarter of 2008,
primarily due to the strengthening of the U.S. Dollar (currency-adjusted revenue per piece declined 3.0%), but
also impacted by an acceleration in the shift away from our premium services and lower package weights. Fourth
quarter 2008 total segment revenue was negatively impacted by $144 million due to the currency fluctuations,
net of hedging activity.
On December 31, 2007, we increased the base rates 6.9% for international shipments originating in the
United States (Worldwide Express, Worldwide Express Plus, UPS Worldwide Expedited and UPS International
Standard service). Rate changes for international shipments originating outside the United States vary by
geographical market and occur throughout the year.
Additionally, we modified the fuel surcharge on certain U.S.-related international air services by reducing
the index used to determine the fuel surcharge by 2%. The fuel surcharge for products originating outside the
United States continues to be indexed to fuel prices in our different international regions, depending upon where
the shipment takes place. Total international fuel surcharge revenue increased by $586 million in 2008, due to
higher fuel surcharge rates caused by increased fuel prices as well as an increase in international air volume.
24