UPS 2008 Annual Report Download - page 36
Download and view the complete annual report
Please find page 36 of the 2008 UPS annual report below. You can navigate through the pages in the report by either clicking on the pages listed below, or by using the keyword search tool below to find specific information within the annual report.-
 1
1 -
2
-
3
-
4
-
5
-
6
-
7
-
8
-
9
-
10
-
11
-
12
-
13
-
14
-
15
-
16
-
17
-
18
-
19
-
20
-
21
-
22
-
23
-
24
-
25
-
 26
26 -
 27
27 -
 28
28 -
 29
29 -
 30
30 -
 31
31 -
 32
32 -
 33
33 -
 34
34 -
 35
35 -
 36
36 -
 37
37 -
 38
38 -
 39
39 -
 40
40 -
 41
41 -
 42
42 -
 43
43 -
 44
44 -
 45
45 -
 46
46 -
47
-
48
-
49
-
50
-
51
-
52
-
53
-
54
-
55
-
56
-
57
-
58
-
59
-
60
-
61
-
62
-
63
-
64
-
65
-
66
-
67
-
68
-
69
-
70
-
71
-
72
-
73
-
74
-
75
-
76
-
77
-
78
-
79
-
80
-
81
-
82
-
83
-
84
-
85
-
86
-
87
-
88
-
89
-
90
-
91
-
92
-
93
-
94
-
95
-
96
-
97
-
98
-
99
-
100
-
101
-
102
-
103
-
104
-
105
-
106
-
107
-
108
-
109
-
110
-
111
-
112
-
113
-
114
-
115
-
116
-
117
-
118
-
119
-
120
 |
 |
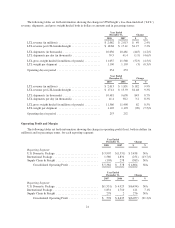
International Package operating profit decreased $251 million, or 13.7%, in 2008, and the operating margin
declined to 14.0% from 17.8% in 2007. The decline in operating profit and operating margin were affected by
reduced asset utilization resulting from changes in economic conditions and trade flows, such as the reduced
import volume into the United States. Operating profit and margin were also negatively affected by a shift in
product mix away from our premium services, as well as expenses associated with integration activities in our
delivery network. Global economic weakness resulted in a weakening operating profit trend, with fourth quarter
operating profit declining 34.3%.
Because fuel costs decreased rapidly in the latter half of the year, operating profit benefited from the
approximate two month time lag between the fuel price changes and when the monthly surcharge rates are
applied to package shipments. As a result of this time lag, fuel positively impacted the change in operating profit
during 2008, which is opposite of the effect the company experienced in 2007, when fuel costs rose much faster
than the fuel surcharge rate and operating profit was adversely impacted. The change in operating profit was also
positively affected by $136 million during the year due to favorable currency exchange rates, net of hedging
activity.
Operating profit in 2008 was adversely impacted by a fourth quarter $27 million impairment charge
incurred on certain intangible assets in our domestic package business in the United Kingdom (discussed further
in the “Operating Expenses” section). Operating profit for 2007 was adversely affected by the aircraft
impairment and SVSO charges ($62 million of the aircraft impairment charge and $7 million of the SVSO charge
impacted the International Package segment), and the absence of these charges in 2008 favorably affected the
operating profit comparison between periods.
2007 compared to 2006
International Package revenue improved $1.192 billion, or 13.1% in 2007, driven by a 10.4% volume
increase for our export products and an 8.3% increase in total revenue per piece. The growth in revenue per piece
was positively impacted by base rate increases and the weakening of the U.S. Dollar against several major
foreign currencies in 2007, but was adversely affected by a lower fuel surcharge rate applied to our U.S. origin
international air products.
Export volume increased throughout the world. Asian export volume grew strongly in key markets during
the year, especially China. Asian export volume continues to benefit from our geographic service expansion, as
well as strong economic growth, which benefits our intra-Asian package business. To continue this expansion,
we received authority in 2007 to operate six daily flights between the U.S. and Nagoya, Japan, and began
constructing a package and freight air hub in Shanghai, China that will link Shanghai to our international air
network, with direct service to Europe, Asia, and the Americas.
European export volume also grew solidly, largely due to continued growth in the transborder business and
improved economic and industrial output in the European Union. U.S. export volume increased at a slower pace.
Non-U.S. domestic volume increased 2.2% for the year, and was impacted by growth in several major European
countries and Canada.
Export revenue per piece increased 3.9% for the year, largely due to rate increases and favorable exchange
rates, but was adversely impacted by relatively higher growth in lower revenue per piece transborder products,
and a reduction in certain fuel surcharge rates. Non-U.S. domestic revenue per piece increased 9.6% for the year,
and was affected by rate increases and favorable exchange rates. Total average revenue per piece increased 2.7%
on a currency-adjusted basis, and the overall change in segment revenue was positively affected by $464 million
in 2007 due to currency fluctuations, net of hedging activity.
In January 2007, we increased rates 6.9% for international shipments originating in the United States
(Worldwide Express, Worldwide Express Plus, UPS Worldwide Expedited and UPS International Standard
service). Rate changes for international shipments originating outside the United States vary by geographical
market and occur throughout the year.
25