UPS 2008 Annual Report Download - page 72
Download and view the complete annual report
Please find page 72 of the 2008 UPS annual report below. You can navigate through the pages in the report by either clicking on the pages listed below, or by using the keyword search tool below to find specific information within the annual report.-
 1
1 -
2
-
3
-
4
-
5
-
6
-
7
-
8
-
9
-
10
-
11
-
12
-
13
-
14
-
15
-
16
-
17
-
18
-
19
-
20
-
21
-
22
-
23
-
24
-
25
-
26
-
27
-
28
-
29
-
30
-
31
-
32
-
33
-
34
-
35
-
36
-
37
-
38
-
39
-
40
-
41
-
42
-
43
-
44
-
45
-
46
-
47
-
48
-
49
-
50
-
51
-
52
-
53
-
54
-
55
-
56
-
57
-
58
-
59
-
60
-
61
-
 62
62 -
 63
63 -
 64
64 -
 65
65 -
 66
66 -
 67
67 -
 68
68 -
 69
69 -
 70
70 -
 71
71 -
 72
72 -
 73
73 -
 74
74 -
 75
75 -
 76
76 -
 77
77 -
 78
78 -
 79
79 -
 80
80 -
 81
81 -
 82
82 -
83
-
84
-
85
-
86
-
87
-
88
-
89
-
90
-
91
-
92
-
93
-
94
-
95
-
96
-
97
-
98
-
99
-
100
-
101
-
102
-
103
-
104
-
105
-
106
-
107
-
108
-
109
-
110
-
111
-
112
-
113
-
114
-
115
-
116
-
117
-
118
-
119
-
120
 |
 |

UNITED PARCEL SERVICE, INC. AND SUBSIDIARIES
NOTES TO CONSOLIDATED FINANCIAL STATEMENTS—(Continued)
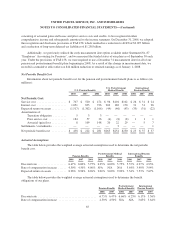
The following table presents the age of gross unrealized losses and fair value by investment category for all
securities in a loss position as of December 31, 2008 (in millions):
Less Than 12 Months 12 Months or More Total
Fair
Value
Unrealized
Losses
Fair
Value
Unrealized
Losses
Fair
Value
Unrealized
Losses
U.S. government and agency securities ............ $ 12 $— $— $— $ 12 $—
Mortgage and asset-backed securities ............. 179 41 31 4 210 45
Corporate securities ........................... 43 2 5 1 48 3
U.S. state and local municipal securities ........... 81 29 — — 81 29
Other debt securities .......................... — — ————
Total debt securities ....................... 315 72 36 5 351 77
Common equity securities ...................... 1 — — — 1 —
Preferred equity securities ...................... 26 21 — — 26 21
$342 $ 93 $ 36 $ 5 $378 $ 98
The unrealized losses in the U.S. state and local municipal securities, preferred equity securities, and
mortgage and asset-backed securities primarily relate to the auction rate securities discussed previously. The
unrealized losses for the non-auction rate securities within those categories are primarily related to various fixed
income securities, and are primarily due to changes in market interest rates. We have both the intent and ability
to hold the securities contained in the previous table for a time necessary to recover the cost basis.
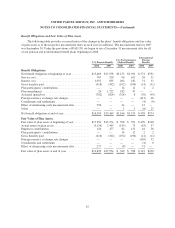
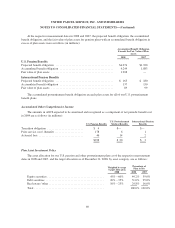
The amortized cost and estimated fair value of marketable securities and short-term investments at
December 31, 2008, by contractual maturity, are shown below (in millions). Actual maturities may differ from
contractual maturities because the issuers of the securities may have the right to prepay obligations without
prepayment penalties.
Cost
Estimated
Fair Value
Due in one year or less ............................................... $ 21 $ 21
Due after one year through three years ................................... 160 162
Due after three years through five years .................................. 27 26
Due after five years .................................................. 589 521
797 730
Equity securities .................................................... 74 56
$871 $786
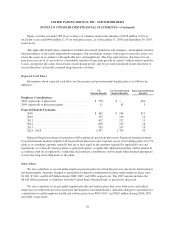
NOTE 3. FINANCE RECEIVABLES
The following is a summary of finance receivables at December 31, 2008 and 2007 (in millions):
2008 2007
Commercial term loans .................................................. $420 $351
Investment in finance leases .............................................. 126 143
Asset-based lending ..................................................... 345 309
Receivable factoring .................................................... 90 109
Gross finance receivables ................................................ 981 912
Less: Allowance for credit losses .......................................... (25) (13)
Balance at December 31 ................................................. $956 $899
61