Tyson Foods 2006 Annual Report Download - page 56
Download and view the complete annual report
Please find page 56 of the 2006 Tyson Foods annual report below. You can navigate through the pages in the report by either clicking on the pages listed below, or by using the keyword search tool below to find specific information within the annual report.-
 1
1 -
2
-
3
-
4
-
5
-
6
-
7
-
8
-
9
-
10
-
11
-
12
-
13
-
14
-
15
-
16
-
17
-
18
-
19
-
20
-
21
-
22
-
23
-
24
-
25
-
26
-
27
-
28
-
29
-
30
-
31
-
32
-
33
-
34
-
35
-
36
-
37
-
38
-
39
-
40
-
41
-
42
-
43
-
44
-
45
-
 46
46 -
 47
47 -
 48
48 -
 49
49 -
 50
50 -
 51
51 -
 52
52 -
 53
53 -
 54
54 -
 55
55 -
 56
56 -
 57
57 -
 58
58 -
 59
59 -
 60
60 -
 61
61 -
 62
62 -
 63
63 -
 64
64 -
 65
65 -
 66
66 -
67
-
68
 |
 |

The majority of the Company’s operations are domiciled in the
United States. Approximately 95%, 94% and 94% of sales to external
customers for fiscal years 2006, 2005 and 2004, respectively, were
sourced from the United States. Approximately $6.3 billion of long-
lived assets were located in the United States at September 30, 2006,
and October 1, 2005, and $6.4 billion at October 2, 2004. Approxi-
mately $197 million, $202 million and $171 million of long-lived
assets were located in foreign countries, primarily Canada and
Mexico, at fiscal years ended 2006, 2005 and 2004, respectively.
The Company sells certain products in foreign markets, primarily
Canada, Central America, China, the European Union, Japan,
Mexico, Russia, South Korea, and Taiwan. The Company’s export
sales totaled $2.1 billion for each of fiscal 2006, 2005 and 2004.
Substantially all of the Company’s export sales are facilitated
through unaffiliated brokers, marketing associations and foreign
sales staffs. Foreign sales, which are sales of products produced in
a country other than the United States, were less than 10% of total
consolidated sales for fiscal 2006, 2005 and 2004. In fiscal 2006,
the Company incurred a loss from foreign operations of $36 million
before taxes and cumulative effect of change in accounting princi-
ple. Approximately 21% and 28% of income before taxes for fiscal
2005 and 2004, respectively, was from foreign operations. The
decline in fiscal 2006 was primarily due to decreased margins at
Tyson de Mexico and the Company’s Lakeside operation in Canada.
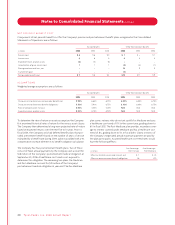
NOTE 18 QUARTERLY FINANCIAL DATA (UNAUDITED)
First SecondThird Fourth
in millions, except per share data Quarter Quarter Quarter Quarter
2006
Sales $6,454 $6,251 $6,383 $6,471
Gross profit 344 153 203 228
Operating income (loss) 110 (142) (25) (20)
Income (loss)
before income taxes 60 (200) (76) (77)
Income tax expense (benefit) 21 (73) (24) (26)
Income (loss) before
cumulative effect of change
in accounting principle 39 (127) (52) (51)
Cumulative effect of change
in accounting principle,
net of tax – – – 5
Net income (loss) 39 (127) (52) (56)
Earnings (loss) before
cumulative effect of change
in accounting principle:
Class A Basic $0.12 $(0.38) $(0.15) $(0.15)
Class B Basic $0.10 $(0.34) $(0.14) $(0.14)
Diluted $0.11 $(0.37) $(0.15) $(0.15)
Cumulative effect of change
in accounting principle,
net of tax:
Class A Basic $ – $ – $ – $ (0.02)
Class B Basic $ – $ – $ – $ (0.01)
Diluted $ – $ – $ – $ (0.02)
Net income (loss):
Class A Basic $0.12 $(0.38) $(0.15) $(0.17)
Class B Basic $0.10 $(0.34) $(0.14) $(0.15)
Diluted $0.11 $(0.37) $(0.15) $(0.17)
2005
Sales $6,452 $6,359 $6,708 $6,495
Gross profit 360 414 519 427
Operating income 126 175 256 188
Net income 48 76 131 117
Class A basic earnings
per share $ 0.14 $0.23 $0.39 $0.35
Class B basic earnings
per share $ 0.13 $0.20 $0.35 $0.32
Diluted earnings per share $ 0.14 $0.21 $0.36 $0.33
54 Ty s on Foods, Inc. 2006 Annual Report
Notes to Consolidated Financial Statements continued