Tyson Foods 2006 Annual Report Download - page 37
Download and view the complete annual report
Please find page 37 of the 2006 Tyson Foods annual report below. You can navigate through the pages in the report by either clicking on the pages listed below, or by using the keyword search tool below to find specific information within the annual report.-
 1
1 -
2
-
3
-
4
-
5
-
6
-
7
-
8
-
9
-
10
-
11
-
12
-
13
-
14
-
15
-
16
-
17
-
18
-
19
-
20
-
21
-
22
-
23
-
24
-
25
-
26
-
 27
27 -
 28
28 -
 29
29 -
 30
30 -
 31
31 -
 32
32 -
 33
33 -
 34
34 -
 35
35 -
 36
36 -
 37
37 -
 38
38 -
 39
39 -
 40
40 -
 41
41 -
 42
42 -
 43
43 -
 44
44 -
 45
45 -
 46
46 -
 47
47 -
48
-
49
-
50
-
51
-
52
-
53
-
54
-
55
-
56
-
57
-
58
-
59
-
60
-
61
-
62
-
63
-
64
-
65
-
66
-
67
-
68
 |
 |

Fair values are based on quoted market prices or published forward
interest rate and natural gas curves. Carrying values for derivative
positions equal the fair values as of September 30, 2006, and
October 1, 2005, and the carrying values of total debt were
$4.0 billion and $3.0 billion, respectively. All other financial instru-
ments’ fair values approximate recorded values at September 30,
2006, and October 1, 2005.
• Concentrations of Credit Risk: The Company’s financial instru-
ments exposed to concentrations of credit risk consist primarily of
cash equivalents, short-term investments and trade receivables. The
Company’s cash equivalents and short-term investments are in high
quality securities placed with major banks and financial institutions.
Concentrations of credit risk with respect to receivables are limited
due to the large number of customers and their dispersion across
geographic areas. The Company performs periodic credit evaluations
of its customers’ financial condition and generally does not require
collateral. At September 30, 2006, and October 1, 2005, approximately
13.0% of the Company’s net accounts receivable balance was due
from one customer. No other single customer or customer group
represents greater than 10% of net accounts receivable.
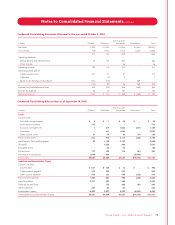
NOTE 6PROPERTY, PLANT AND EQUIPMENT
The major categories of property, plant and equipment and
accumulated depreciation at cost, at September 30, 2006,
and October 1, 2005, are as follows:
in millions 2006 2005
Land $114 $ 113
Building and leasehold improvements 2,453 2,339
Machinery and equipment 4,270 4,015
Land improvements and other 202 195
Buildings and equipment under construction 279 407
7,318 7,069
Less accumulated depreciation 3,373 3,062
Net property, plant and equipment $3,945 $4,007
The Company’s total depreciation expense was $481 million,
$465 million and $458 million in fiscal 2006, 2005 and 2004,
respectively. The Company capitalized interest costs of $8 million,
$6 million and $3 million in fiscal 2006, 2005 and 2004, respectively,
as part of the cost of major asset construction projects. Approxi-
mately $182 million will be required to complete construction proj-
ects in progress at September 30, 2006.
NOTE 7OTHER CURRENT LIABILITIES
Other current liabilities at September 30, 2006, and October 1,
2005, include:
in millions 2006 2005
Accrued salaries, wages and benefits $280 $ 269
Self-insurance reserves 265 252
Income taxes payable –183
Other 367 366
Total other current liabilities $912 $1,070
NOTE 8COMMITMENTS
The Company leases equipment, properties and certain farms for
which the total rentals approximated $146 million in fiscal 2006,
$116 million in fiscal 2005 and $111 million in fiscal 2004. Most leases
have terms ranging from one to seven years with varying renewal
periods. The most significant obligations assumed under the
terms of the leases are the upkeep of the facilities and payments
of insurance and property taxes.
Minimum lease commitments under non-cancelable leases at
September 30, 2006, totaled $239 million composed of $87 million
for fiscal 2007, $59 million for fiscal 2008, $39 million for fiscal
2009, $23 million for fiscal 2010, $14 million for fiscal 2011 and
$17 million for later years.
The Company guarantees debt of outside third parties, which involve
a lease and grower loans, all of which are substantially collateral-
ized by the underlying assets. Terms of the underlying debt range
from two to nine years, and the maximum potential amount of
future payments as of September 30, 2006, was $79 million. The
Company also maintains operating leases for various types of
equipment, some of which contain residual value guarantees for
the market value of assets at the end of the term of the lease.
The terms of the lease maturities range from one to seven years.
The maximum potential amount of the residual value guarantees
is approximately $110 million, of which approximately $26 million
would be recoverable through various recourse provisions and
Ty s on Foods, Inc. 2006 Annual Report35
Notes to Consolidated Financial Statements continued